HAIChart: Human and AI Paired Visualization System
2406.11033
0
0

Abstract
The growing importance of data visualization in business intelligence and data science emphasizes the need for tools that can efficiently generate meaningful visualizations from large datasets. Existing tools fall into two main categories: human-powered tools (e.g., Tableau and PowerBI), which require intensive expert involvement, and AI-powered automated tools (e.g., Draco and Table2Charts), which often fall short of guessing specific user needs. In this paper, we aim to achieve the best of both worlds. Our key idea is to initially auto-generate a set of high-quality visualizations to minimize manual effort, then refine this process iteratively with user feedback to more closely align with their needs. To this end, we present HAIChart, a reinforcement learning-based framework designed to iteratively recommend good visualizations for a given dataset by incorporating user feedback. Specifically, we propose a Monte Carlo Graph Search-based visualization generation algorithm paired with a composite reward function to efficiently explore the visualization space and automatically generate good visualizations. We devise a visualization hints mechanism to actively incorporate user feedback, thus progressively refining the visualization generation module. We further prove that the top-k visualization hints selection problem is NP-hard and design an efficient algorithm. We conduct both quantitative evaluations and user studies, showing that HAIChart significantly outperforms state-of-the-art human-powered tools (21% better at Recall and 1.8 times faster) and AI-powered automatic tools (25.1% and 14.9% better in terms of Hit@3 and R10@30, respectively).
Create account to get full access
Overview
• HAIChart is a human and AI paired visualization system that aims to combine the strengths of human creativity and AI precision to create more effective data visualizations.
Plain English Explanation
• HAIChart takes advantage of the complementary abilities of humans and AI algorithms. Humans excel at high-level reasoning, abstract thinking, and generating novel ideas, while AI models are adept at processing large amounts of data and spotting patterns that may not be obvious to the human eye.
• The system allows users to collaborate with an AI assistant to create data visualizations. The user provides the initial high-level goals and constraints, and the AI then generates a set of candidate visualizations. The user can then refine and iterate on these options, with the AI providing real-time feedback and suggestions to help improve the visualizations.
• By blending human and machine intelligence, HAIChart aims to produce data visualizations that are both aesthetically pleasing and effectively communicate insights. The Guided by AI: Navigating Trust, Bias, and Data and Harmonizing Human Insights and AI Precision: Hand in Hand papers explore similar ideas around leveraging the complementary strengths of humans and AI for data visualization and analysis.
Technical Explanation
• HAIChart consists of several key components:
- User interface: Allows users to provide high-level goals and constraints for the desired visualization.
- AI visualization generator: An AI model that can generate a diverse set of candidate visualizations based on the user's input.
- Visualization refinement and iteration: The user can select preferred visualizations and further refine them, with the AI providing real-time feedback and suggestions.
- Visualization ranking and selection: The system ultimately selects the best visualization based on a combination of user preferences and AI-based evaluation metrics.
• The paper describes the architecture and implementation of HAIChart, as well as the results of user studies evaluating the system's effectiveness. The authors find that HAIChart can produce higher-quality visualizations compared to human-only or AI-only approaches, as evidenced by metrics like user satisfaction, information clarity, and aesthetic appeal.
Critical Analysis
• The paper provides a promising approach to leveraging the strengths of both humans and AI for data visualization. However, it does not address potential biases or limitations of the AI models used, which could be an important consideration.
• Additionally, the user studies were conducted with a relatively small sample size, so further research may be needed to validate the findings and understand the generalizability of the results.
• The Towards Intent-Based User Interfaces: Charting the Design and Generative AI for Visualization: State of the Art and Future Directions papers discuss related challenges and considerations in the design of AI-assisted visualization systems.
Conclusion
• HAIChart demonstrates the potential of combining human and AI capabilities to create more effective data visualizations. By leveraging the complementary strengths of humans and machines, the system can produce visualizations that are both aesthetically pleasing and informative.
• While the research shows promising results, further study is needed to address potential biases and limitations of the AI components, as well as to validate the findings with larger-scale user evaluations. Nonetheless, HAIChart represents an important step towards Harder, Better, Faster, Stronger: Interactive Visualization with Human-AI Collaboration, where humans and AI work hand-in-hand to unlock new possibilities in data visualization and analysis.
This summary was produced with help from an AI and may contain inaccuracies - check out the links to read the original source documents!
Related Papers
🤖
Harder, Better, Faster, Stronger: Interactive Visualization for Human-Centered AI Tools
Md Naimul Hoque, Sungbok Shin, Niklas Elmqvist
0
0
Human-centered AI (HCAI), rather than replacing the human, puts the human user in the driver's seat of so-called human-centered AI-infused tools (HCAI tools): interactive software tools that amplify, augment, empower, and enhance human performance using AI models; often novel generative or foundation AI ones. In this paper, we discuss how interactive visualization can be a key enabling technology for creating such human-centered AI tools. Visualization has already been shown to be a fundamental component in explainable AI models, and coupling this with data-driven, semantic, and unified interaction feedback loops will enable a human-centered approach to integrating AI models in the loop with human users. We present several examples of our past and current work on such HCAI tools, including for creative writing, temporal prediction, and user experience analysis. We then draw parallels between these tools to suggest common themes on how interactive visualization can support the design of future HCAI tools.
4/3/2024
📊
Guided By AI: Navigating Trust, Bias, and Data Exploration in AI-Guided Visual Analytics
Sunwoo Ha, Shayan Monadjemi, Alvitta Ottley
0
0
The increasing integration of artificial intelligence (AI) in visual analytics (VA) tools raises vital questions about the behavior of users, their trust, and the potential of induced biases when provided with guidance during data exploration. We present an experiment where participants engaged in a visual data exploration task while receiving intelligent suggestions supplemented with four different transparency levels. We also modulated the difficulty of the task (easy or hard) to simulate a more tedious scenario for the analyst. Our results indicate that participants were more inclined to accept suggestions when completing a more difficult task despite the AI's lower suggestion accuracy. Moreover, the levels of transparency tested in this study did not significantly affect suggestion usage or subjective trust ratings of the participants. Additionally, we observed that participants who utilized suggestions throughout the task explored a greater quantity and diversity of data points. We discuss these findings and the implications of this research for improving the design and effectiveness of AI-guided VA tools.
4/24/2024
Generative AI for Visualization: State of the Art and Future Directions
Yilin Ye, Jianing Hao, Yihan Hou, Zhan Wang, Shishi Xiao, Yuyu Luo, Wei Zeng
0
0
Generative AI (GenAI) has witnessed remarkable progress in recent years and demonstrated impressive performance in various generation tasks in different domains such as computer vision and computational design. Many researchers have attempted to integrate GenAI into visualization framework, leveraging the superior generative capacity for different operations. Concurrently, recent major breakthroughs in GenAI like diffusion model and large language model have also drastically increase the potential of GenAI4VIS. From a technical perspective, this paper looks back on previous visualization studies leveraging GenAI and discusses the challenges and opportunities for future research. Specifically, we cover the applications of different types of GenAI methods including sequence, tabular, spatial and graph generation techniques for different tasks of visualization which we summarize into four major stages: data enhancement, visual mapping generation, stylization and interaction. For each specific visualization sub-task, we illustrate the typical data and concrete GenAI algorithms, aiming to provide in-depth understanding of the state-of-the-art GenAI4VIS techniques and their limitations. Furthermore, based on the survey, we discuss three major aspects of challenges and research opportunities including evaluation, dataset, and the gap between end-to-end GenAI and generative algorithms. By summarizing different generation algorithms, their current applications and limitations, this paper endeavors to provide useful insights for future GenAI4VIS research.
4/30/2024
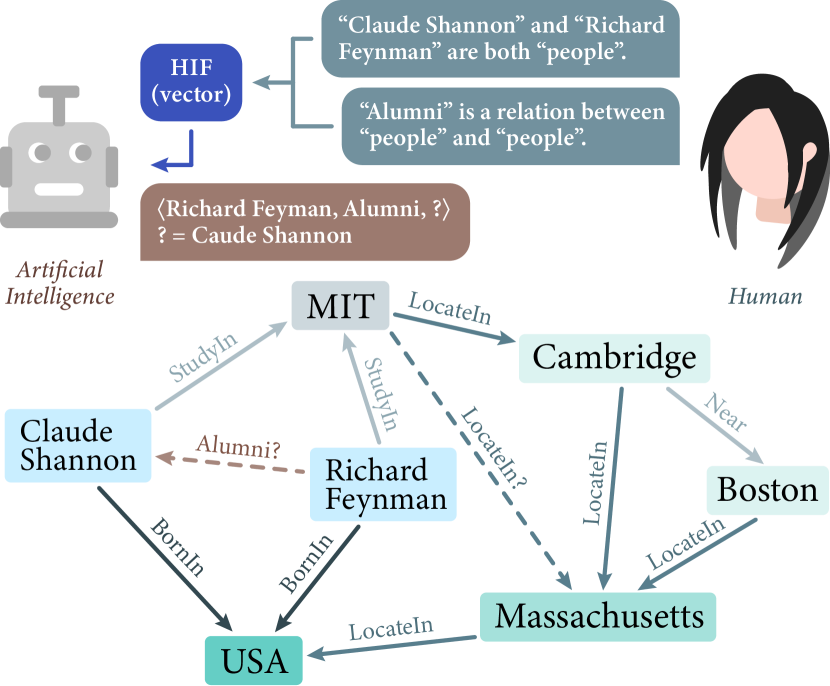
Harmonizing Human Insights and AI Precision: Hand in Hand for Advancing Knowledge Graph Task
Shurong Wang, Yufei Zhang, Xuliang Huang, Hongwei Wang
0
0
Knowledge graph embedding (KGE) has caught significant interest for its effectiveness in knowledge graph completion (KGC), specifically link prediction (LP), with recent KGE models cracking the LP benchmarks. Despite the rapidly growing literature, insufficient attention has been paid to the cooperation between humans and AI on KG. However, humans' capability to analyze graphs conceptually may further improve the efficacy of KGE models with semantic information. To this effect, we carefully designed a human-AI team (HAIT) system dubbed KG-HAIT, which harnesses the human insights on KG by leveraging fully human-designed ad-hoc dynamic programming (DP) on KG to produce human insightful feature (HIF) vectors that capture the subgraph structural feature and semantic similarities. By integrating HIF vectors into the training of KGE models, notable improvements are observed across various benchmarks and metrics, accompanied by accelerated model convergence. Our results underscore the effectiveness of human-designed DP in the task of LP, emphasizing the pivotal role of collaboration between humans and AI on KG. We open avenues for further exploration and innovation through KG-HAIT, paving the way towards more effective and insightful KG analysis techniques.
5/16/2024