Augmenting Static Visualizations with PapARVis Designer
2310.04826
0
0
❗
Abstract
This paper presents an authoring environment for augmenting static visualizations with virtual content in augmented reality. Augmenting static visualizations can leverage the best of both physical and digital worlds, but its creation currently involves different tools and devices, without any means to explicitly design and debug both static and virtual content simultaneously. To address these issues, we design an environment that seamlessly integrates all steps of a design and deployment workflow through its main features: i) an extension to Vega, ii) a preview, and iii) debug hints that facilitate valid combinations of static and augmented content. We inform our design through a design space with four ways to augment static visualizations. We demonstrate the expressiveness of our tool through examples, including books, posters, projections, wall-sized visualizations. A user study shows high user satisfaction of our environment and confirms that participants can create augmented visualizations in an average of 4.63 minutes.
Create account to get full access
Overview
- This paper presents an authoring environment for augmenting static visualizations with virtual content in augmented reality.
- The environment integrates all steps of the design and deployment workflow, including an extension to the Vega visualization language, a preview feature, and debug hints.
- The authors inform their design through a design space of four ways to augment static visualizations, and demonstrate the expressiveness of their tool through examples.
- A user study shows high user satisfaction and the ability for participants to create augmented visualizations in an average of 4.63 minutes.
Plain English Explanation
The paper describes a new tool that makes it easier to create augmented reality (AR) experiences that combine physical, static visualizations like posters or books with virtual, digital content. Traditionally, designing these types of "augmented visualizations" has involved using different tools and devices, without a way to easily design and test both the physical and virtual aspects together.
The new authoring environment presented in the paper aims to streamline this process. It has three key features: 1) an extension to the popular Vega visualization language that allows authors to specify the virtual content, 2) a preview mode that lets authors see how the physical and virtual elements will look together, and 3) debugging tools to help ensure the two elements are properly aligned and integrated.
The authors developed this tool based on their analysis of four different ways that static visualizations can be augmented with virtual content. They demonstrate the versatility of their approach by showing examples of augmented books, posters, projections, and large wall-sized visualizations.
In a user study, participants were able to create their own augmented visualizations using the tool in less than 5 minutes on average, and reported being highly satisfied with the experience. This suggests the new authoring environment can make it much easier for designers and researchers to leverage the benefits of combining physical and digital elements in their visualizations.
Technical Explanation
The core contribution of this paper is the design and implementation of an authoring environment for augmented visualizations. The environment integrates three key features:
-
Vega Extension: The authors extend the popular Vega visualization language to allow authors to specify the virtual content that will be overlaid on the physical, static visualization. This provides a unified way to design both the physical and digital elements.
-
Preview: The authoring environment includes a preview mode that lets authors see how the physical and virtual content will be combined in the final augmented reality experience. This allows for iterative design and debugging.
-
Debug Hints: To help ensure valid combinations of physical and virtual content, the environment provides debug hints that flag potential issues or conflicts between the two elements.
The authors ground their design in a taxonomy of four ways that static visualizations can be augmented:
A user study with 12 participants shows that they were able to create augmented visualizations using the authoring environment in an average of 4.63 minutes, and reported high levels of satisfaction with the experience. This suggests the environment succeeds in streamlining the authoring process for these types of augmented visualizations.
Critical Analysis
The paper provides a compelling solution to the challenge of authoring augmented visualizations that combine physical and virtual elements. By integrating the design of both components into a single environment, the authors make it much easier for designers to create these types of experiences.
However, the paper does not address some potential limitations or areas for future work. For example, the authoring environment is focused on 2D static visualizations, and it's unclear how well it would extend to 3D physical objects or more complex virtual content. Additionally, the user study was relatively small, and more extensive real-world testing would be needed to fully validate the usability and practicality of the tool.
Another area for further research could be exploring ways to preserve the history and context of augmented visualizations as they are edited and updated over time. This could help ensure the integrity and provenance of these hybrid physical-digital artifacts.
Overall, the authoring environment presented in this paper represents an important step towards making it easier to develop multi-platform scientific visualization applications that leverage the strengths of both the physical and digital worlds. With further refinement and expansion, this type of tool could become a valuable resource for data visualization researchers and designers.
Conclusion
This paper introduces a novel authoring environment that simplifies the process of creating augmented reality experiences that combine physical, static visualizations with virtual, digital content. By integrating key features like a Vega extension, preview mode, and debugging tools, the environment streamlines the design and deployment workflow.
The authors' taxonomy of four ways to augment static visualizations, and the diverse examples they demonstrate, highlight the broad applicability of this approach. And the positive results from the user study suggest the environment can enable even non-expert users to quickly and effectively augment sports videos or visualizations with virtual content.
Overall, this work represents an important contribution towards making it easier for designers, researchers, and the general public to leverage the unique benefits of combining physical and digital elements in their visualizations and information experiences.
This summary was produced with help from an AI and may contain inaccuracies - check out the links to read the original source documents!
Related Papers
🔍
MARVisT: Authoring Glyph-based Visualization in Mobile Augmented Reality
Chen Zhu-Tian, Yijia Su, Yifang Wang, Qianwen Wang, Huamin Qu, Yingcai Wu
0
0
Recent advances in mobile augmented reality (AR) techniques have shed new light on personal visualization for their advantages of fitting visualization within personal routines, situating visualization in a real-world context, and arousing users' interests. However, enabling non-experts to create data visualization in mobile AR environments is challenging given the lack of tools that allow in-situ design while supporting the binding of data to AR content. Most existing AR authoring tools require working on personal computers or manually creating each virtual object and modifying its visual attributes. We systematically study this issue by identifying the specificity of AR glyph-based visualization authoring tool and distill four design considerations. Following these design considerations, we design and implement MARVisT, a mobile authoring tool that leverages information from reality to assist non-experts in addressing relationships between data and virtual glyphs, real objects and virtual glyphs, and real objects and data. With MARVisT, users without visualization expertise can bind data to real-world objects to create expressive AR glyph-based visualizations rapidly and effortlessly, reshaping the representation of the real world with data. We use several examples to demonstrate the expressiveness of MARVisT. A user study with non-experts is also conducted to evaluate the authoring experience of MARVisT.
5/14/2024

Augmented Physics: A Machine Learning-Powered Tool for Creating Interactive Physics Simulations from Static Diagrams
Aditya Gunturu, Yi Wen, Jarin Thundathil, Nandi Zhang, Rubaiat Habib Kazi, Ryo Suzuki
0
0
We introduce Augmented Physics, a machine learning-powered tool designed for creating interactive physics simulations from static textbook diagrams. Leveraging computer vision techniques, such as Segment Anything and OpenCV, our web-based system enables users to semi-automatically extract diagrams from physics textbooks and then generate interactive simulations based on the extracted content. These interactive diagrams are seamlessly integrated into scanned textbook pages, facilitating interactive and personalized learning experiences across various physics concepts, including gravity, optics, circuits, and kinematics. Drawing on an elicitation study with seven physics instructors, we explore four key augmentation techniques: 1) augmented experiments, 2) animated diagrams, 3) bi-directional manipulatives, and 4) parameter visualization. We evaluate our system through technical evaluation, a usability study (N=12), and expert interviews (N=12). The study findings suggest that our system can facilitate more engaging and personalized learning experiences in physics education.
5/30/2024
Turning Text and Imagery into Captivating Visual Video
Mingming Wang, Elijah Miller
0
0
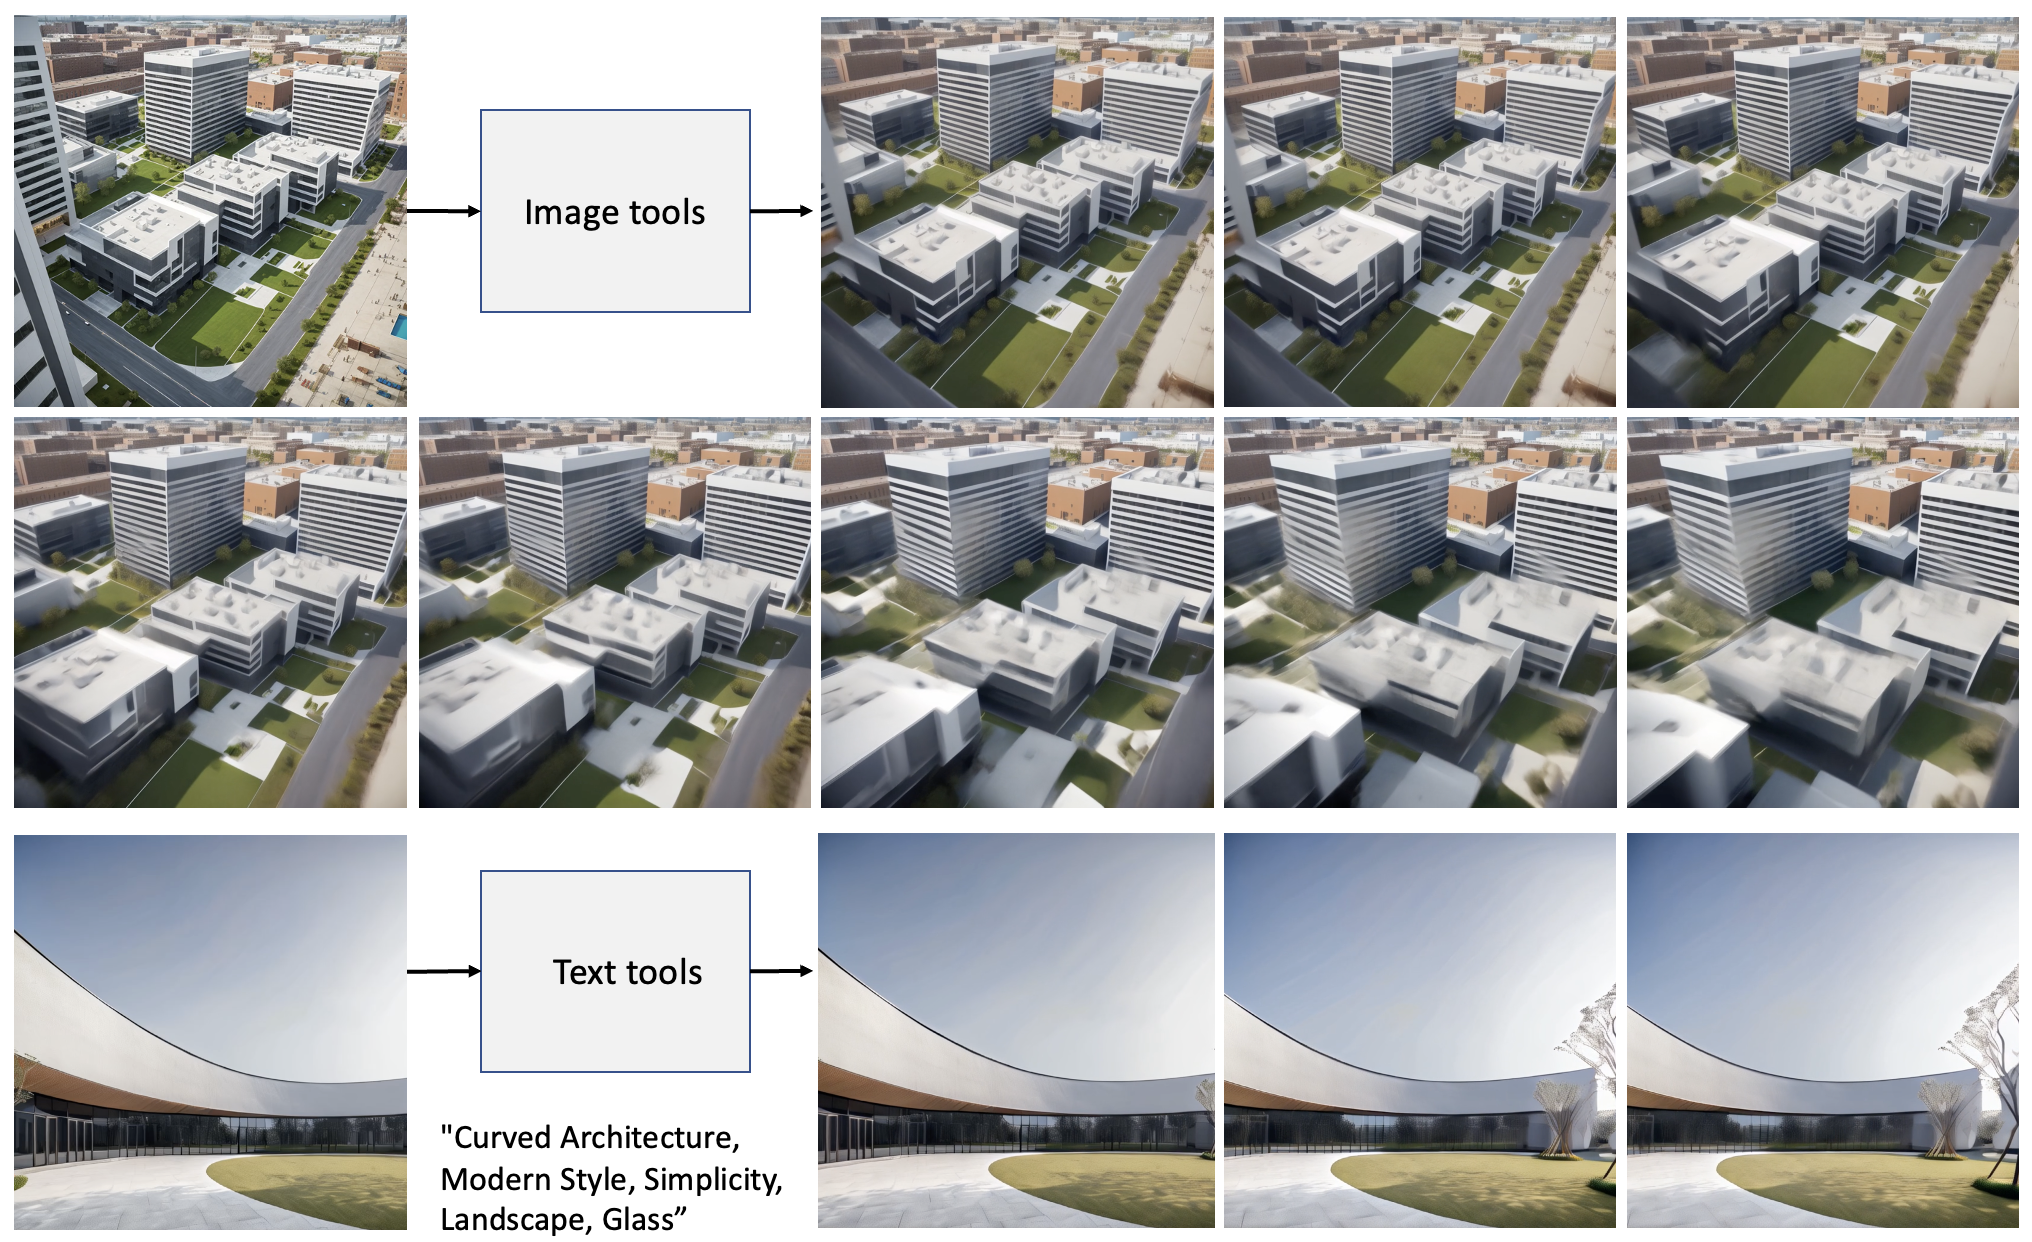
The ability to visualize a structure from multiple perspectives is crucial for comprehensive planning and presentation. This paper introduces an advanced application of generative models, akin to Stable Video Diffusion, tailored for architectural visualization. We explore the potential of these models to create consistent multi-perspective videos of buildings from single images and to generate design videos directly from textual descriptions. The proposed method enhances the design process by offering rapid prototyping, cost and time efficiency, and an enriched creative space for architects and designers. By harnessing the power of AI, our approach not only accelerates the visualization of architectural concepts but also enables a more interactive and immersive experience for clients and stakeholders. This advancement in architectural visualization represents a significant leap forward, allowing for a deeper exploration of design possibilities and a more effective communication of complex architectural ideas.
6/5/2024

Augmenting Sports Videos with VisCommentator
Chen Zhu-Tian, Shuainan Ye, Xiangtong Chu, Haijun Xia, Hui Zhang, Huamin Qu, Yingcai Wu
0
0
Visualizing data in sports videos is gaining traction in sports analytics, given its ability to communicate insights and explicate player strategies engagingly. However, augmenting sports videos with such data visualizations is challenging, especially for sports analysts, as it requires considerable expertise in video editing. To ease the creation process, we present a design space that characterizes augmented sports videos at an element-level (what the constituents are) and clip-level (how those constituents are organized). We do so by systematically reviewing 233 examples of augmented sports videos collected from TV channels, teams, and leagues. The design space guides selection of data insights and visualizations for various purposes. Informed by the design space and close collaboration with domain experts, we design VisCommentator, a fast prototyping tool, to eases the creation of augmented table tennis videos by leveraging machine learning-based data extractors and design space-based visualization recommendations. With VisCommentator, sports analysts can create an augmented video by selecting the data to visualize instead of manually drawing the graphical marks. Our system can be generalized to other racket sports (e.g., tennis, badminton) once the underlying datasets and models are available. A user study with seven domain experts shows high satisfaction with our system, confirms that the participants can reproduce augmented sports videos in a short period, and provides insightful implications into future improvements and opportunities.
5/14/2024