A Comparative Study of Table Sized Physicalization and Digital Visualization

0

Sign in to get full access
Overview
- This paper presents a comparative study of table-sized physicalization and digital visualization.
- The researchers investigated the impact of different data representation formats on user performance, experience, and preferences.
- They conducted experiments to compare physical and digital representations of the same datasets across various tasks and settings.
Plain English Explanation
The researchers wanted to understand how people interact with and perceive data that is presented in physical versus digital formats. They created physical models and digital visualizations of the same datasets and had participants complete various tasks with each type of representation.
The physical models were 3D-printed objects that allowed users to touch and manipulate the data. The digital visualizations were interactive computer graphics. The researchers looked at factors like how quickly and accurately participants could interpret the data, how engaged they felt, and which format they preferred.
The goal was to provide insights into the trade-offs between physical and digital data representations and help designers choose the best format for their needs. For example, physical models might be better for collaborative analysis, while digital visualizations could be more convenient for remote work.
Technical Explanation
The researchers conducted a between-subjects experiment with 48 participants. They created physical and digital representations of the same datasets, including simple bar charts and more complex 3D models.
Participants were randomly assigned to use either the physical or digital versions and asked to complete a series of tasks, such as identifying trends, comparing values, and exploring the data. The researchers measured performance metrics like accuracy and response time, as well as subjective factors like engagement and preference.
The results showed that participants generally performed better and reported higher engagement with the physical representations, especially for more complex datasets. However, the digital visualizations were seen as more convenient and better suited for remote collaboration.
The researchers discuss the trade-offs between the two formats and provide design recommendations for choosing the appropriate representation based on the specific needs of the data and the usage context.
Critical Analysis
The study provides valuable insights into the comparative strengths and weaknesses of physical and digital data representations. However, the sample size is relatively small, and the tasks were limited in scope. Further research is needed to explore a wider range of datasets, user tasks, and real-world scenarios.
Additionally, the study does not delve deeply into the potential long-term effects of using physical versus digital representations, such as their impact on memory, learning, and problem-solving over time.
The researchers also acknowledge that their findings may be influenced by the specific implementation and design of the physical and digital prototypes used in the study. Replicating the experiment with different physical and digital representations could help validate the generalizability of the results.
Conclusion
This study provides a valuable comparison of table-sized physicalization and digital visualization, highlighting the unique strengths and weaknesses of each format. The findings suggest that physical representations can enhance user engagement and performance, especially for complex datasets, while digital visualizations offer greater convenience and remote collaboration capabilities.
The insights from this research can help inform the design of data visualization and exploration tools, allowing developers to choose the most appropriate format based on the specific needs of their users and applications. As the field of data physicalization continues to evolve, further studies in this area will be crucial for advancing our understanding of how people interact with and make sense of data.
This summary was produced with help from an AI and may contain inaccuracies - check out the links to read the original source documents!
Related Papers
0
A Comparative Study of Table Sized Physicalization and Digital Visualization
Yanxin Wang, Yihan Liu, Lingyun Yu, Chengtao Ji, Yu Liu
Data physicalization is gaining popularity in public and educational contexts due to its potential to make abstract data more tangible and understandable. Despite its growing use, there remains a significant gap in our understanding of how large-size physical visualizations compare to their digital counterparts in terms of user comprehension and memory retention. This study aims to bridge this knowledge gap by comparing the effectiveness of visualizing school building history data on large digital screens versus large physical models. Our experimental approach involved 32 participants who were exposed to one of the visualization mediums. We assessed their user experience and immediate understanding of the content, measured through tests after exposure, and evaluated memory retention with follow-up tests seven days later. The results revealed notable differences between the two forms of visualization: physicalization not only facilitated better initial comprehension but also significantly enhanced long-term memory retention. Furthermore, user feedback on usability was also higher on physicalization. These findings underscore the substantial impact of physicalization in improving information comprehension and retention. This study contributes crucial insights into future visualization media selection in educational and public settings.
Read more9/12/2024

0
Investigating the Effect of Operation Mode and Manifestation on Physicalizations of Dynamic Processes
Daniel Pahr, Henry Ehlers, Hsiang-Yun Wu, Manuela Waldner, Renata G. Raidou
We conducted a study to systematically investigate the communication of complex dynamic processes along a two-dimensional design space, where the axes represent a representation's manifestation (physical or virtual) and operation (manual or automatic). We exemplify the design space on a model embodying cardiovascular pathologies, represented by a mechanism where a liquid is pumped into a draining vessel, with complications illustrated through modifications to the model. The results of a mixed-methods lab study with 28 participants show that both physical manifestation and manual operation have a strong positive impact on the audience's engagement. The study does not show a measurable knowledge increase with respect to cardiovascular pathologies using manually operated physical representations. However, subjectively, participants report a better understanding of the process-mainly through non-visual cues like haptics, but also auditory cues. The study also indicates an increased task load when interacting with the process, which, however, seems to play a minor role for the participants. Overall, the study shows a clear potential of physicalization for the communication of complex dynamic processes, which only fully unfold if observers have to chance to interact with the process.
Read more5/16/2024
0
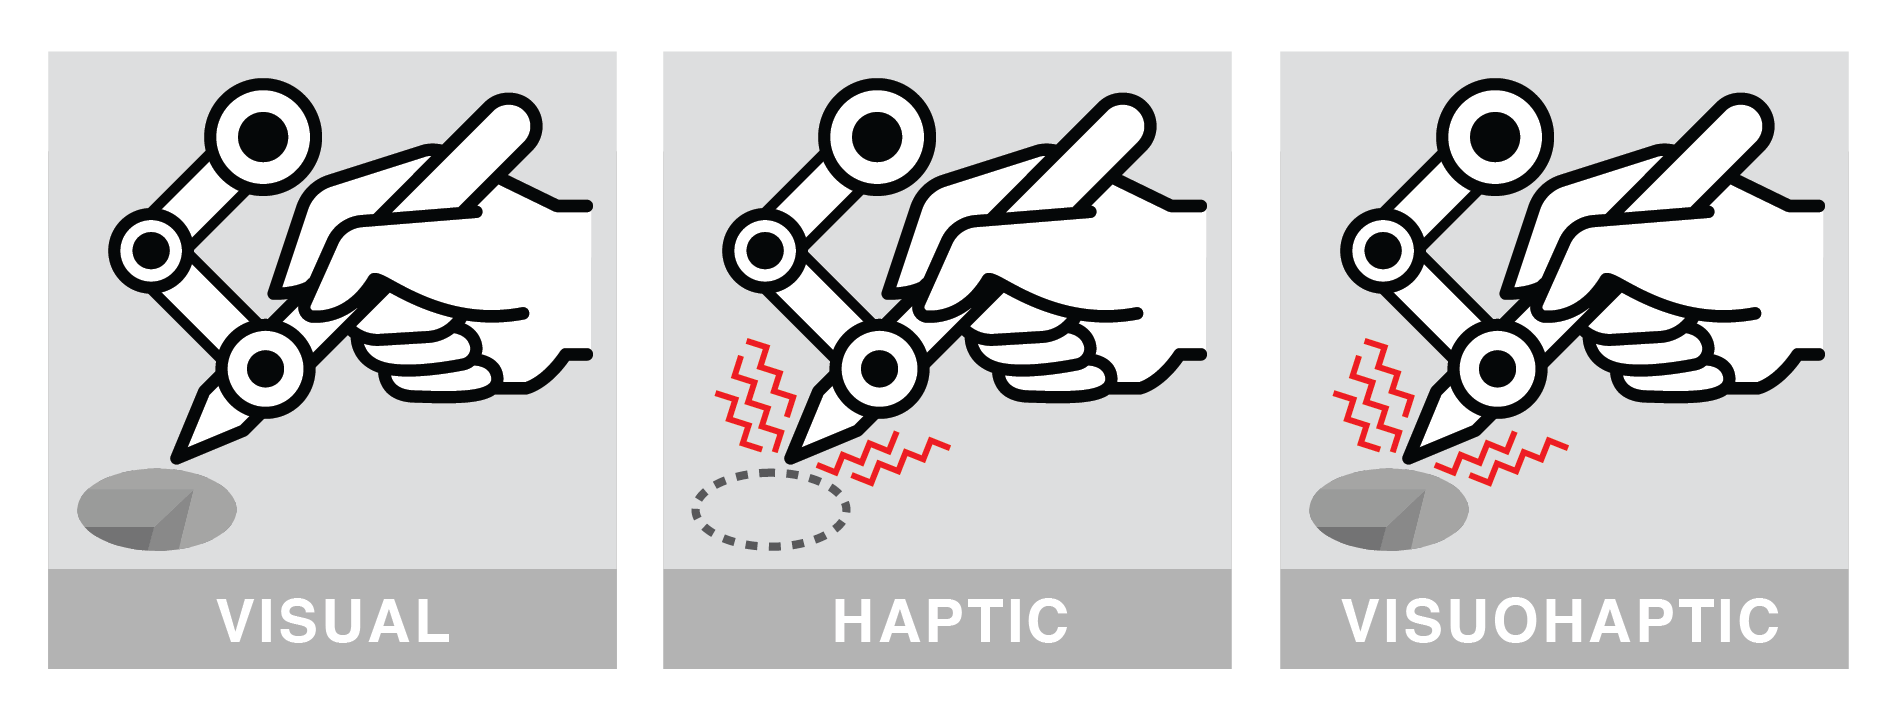
Comparing the Effects of Visual, Haptic, and Visuohaptic Encoding on Memory Retention of Digital Objects in Virtual Reality
Lucas Siqueira Rodrigues, Timo Torsten Schmidt, John Nyakatura, Stefan Zachow, Johann Habakuk Israel, Thomas Kosch
Although Virtual Reality (VR) has undoubtedly improved human interaction with 3D data, users still face difficulties retaining important details of complex digital objects in preparation for physical tasks. To address this issue, we evaluated the potential of visuohaptic integration to improve the memorability of virtual objects in immersive visualizations. In a user study (N=20), participants performed a delayed match-to-sample task where they memorized stimuli of visual, haptic, or visuohaptic encoding conditions. We assessed performance differences between these encoding modalities through error rates and response times. We found that visuohaptic encoding significantly improved memorization accuracy compared to unimodal visual and haptic conditions. Our analysis indicates that integrating haptics into immersive visualizations enhances the memorability of digital objects. We discuss its implications for the optimal encoding design in VR applications that assist professionals who need to memorize and recall virtual objects in their daily work.
Read more9/17/2024

0
Does empirical evidence from healthy aging studies predict a practical difference between visualizations for different age groups?
S. Shao, Y. Li, A. I. Meso, N. Holliman
When communicating critical information to decision-makers, one of the major challenges in visualization is whether the communication is affected by different perceptual or cognitive abilities, one major influencing factor is age. We review both visualization and psychophysics literature to understand where quantitative evidence exists on age differences in visual perception. Using contrast sensitivity data from the literature we show how the differences between visualizations for different age groups can be predicted using a new model of visible frequency range with age. The model assumed that at threshold values some visual data will not be visible to older people (spatial frequency > 2 and contrast <=0.01). We apply this result to a practical visualization and show an example that at higher levels of contrast, the visual signal should be perceivable by all viewers over 20. Universally usable visualization should use a contrast of 0.02 or higher and be designed to avoid spatial frequencies greater than eight cycles per degree to accommodate all ages. There remains much research to do on to translate psychophysics results to practical quantitative guidelines for visualization producers.
Read more8/1/2024