Interactive Visual Analysis of Spatial Sensitivities

0
Sign in to get full access
Overview
- Introduces an interactive visual analysis tool for exploring spatial sensitivities in simulation ensembles
- Enables users to interactively investigate how input parameters affect simulation outputs across spatial domains
- Combines sensitivity analysis techniques with interactive visualization to support decision-making and model understanding
Plain English Explanation
This paper presents an interactive visual analysis tool that helps users understand how changes in input parameters affect the outcomes of spatial simulations. Often, complex simulations have many input variables that can influence the final results in different ways across the spatial domain. The researchers have developed a system that allows users to explore these [spatial sensitivities] interactively.
The tool combines [sensitivity analysis] techniques, which quantify how much each input parameter affects the simulation outputs, with [interactive visualization] methods. This allows users to see at a glance which parts of the spatial domain are most sensitive to changes in each input parameter. By manipulating the input variables and observing the corresponding changes in the simulation outputs, users can gain a deeper understanding of the model and make more informed decisions.
The interactive nature of the tool is key, as it enables users to quickly explore different "what-if" scenarios and uncover hidden relationships between inputs and outputs. This can be especially valuable when working with large, complex simulation ensembles, where manually analyzing all the possible interactions would be very challenging.
Technical Explanation
The researchers developed an interactive visual analysis system that integrates [sensitivity analysis] techniques with [interactive visualization] methods to support the exploration of spatial sensitivities in simulation ensembles.
The system first performs a [global sensitivity analysis] on the simulation model, using techniques like [Sobol sensitivity indices] to quantify the influence of each input parameter on the simulation outputs across the spatial domain. This sensitivity information is then used to drive the interactive visualization, which allows users to:
- Explore spatial sensitivities: Users can interactively select input parameters and observe how changes in those parameters affect the simulation outputs at different spatial locations.
- Investigate parameter dependencies: The system provides tools to analyze how multiple input parameters interact and influence the simulation outputs together.
- Compare simulation ensembles: Users can compare sensitivity patterns across multiple simulation runs or ensemble members to identify commonalities and differences.
The interactive visualizations are implemented using [D3.js], a popular JavaScript library for creating data visualizations on the web. The system supports a range of spatial data types, including [raster data] and [vector data], and provides various visualization techniques, such as [heat maps], [scatter plots], and [parallel coordinates].
Critical Analysis
The researchers acknowledge several limitations and areas for further research. For example, the current system only supports [global sensitivity analysis] methods, which may not capture all the nuances of parameter dependencies, especially for highly nonlinear or complex models. Additionally, the interactive visualizations, while powerful, can become cluttered and difficult to interpret when dealing with very large simulation ensembles or high-dimensional parameter spaces.
Further research could explore the use of [local sensitivity analysis] techniques, which may provide more detailed insights into parameter sensitivities in specific regions of the spatial domain. Integrating [uncertainty visualization] methods could also help users better understand the reliability and robustness of the simulation results.
Despite these limitations, the interactive visual analysis system presented in this paper represents a significant advancement in the field of [spatial sensitivity analysis]. By combining established sensitivity analysis techniques with interactive visualization, the researchers have created a powerful tool that can help users gain a deeper understanding of their simulation models and make more informed decisions.
Conclusion
This paper introduces an interactive visual analysis system that enables users to explore spatial sensitivities in simulation ensembles. By integrating [sensitivity analysis] techniques with [interactive visualization], the system allows users to investigate how changes in input parameters affect simulation outputs across the spatial domain, analyze parameter dependencies, and compare simulation ensembles.
The interactive and visual nature of the tool is a key strength, as it empowers users to quickly explore different "what-if" scenarios and uncover hidden relationships in complex simulation models. While the current system has some limitations, the researchers have demonstrated a novel and valuable approach to supporting decision-making and model understanding in the realm of spatial simulations.
This summary was produced with help from an AI and may contain inaccuracies - check out the links to read the original source documents!
Related Papers
0
Interactive Visual Analysis of Spatial Sensitivities
Marina Evers, Simon Leistikow, Hennes Rave, Lars Linsen
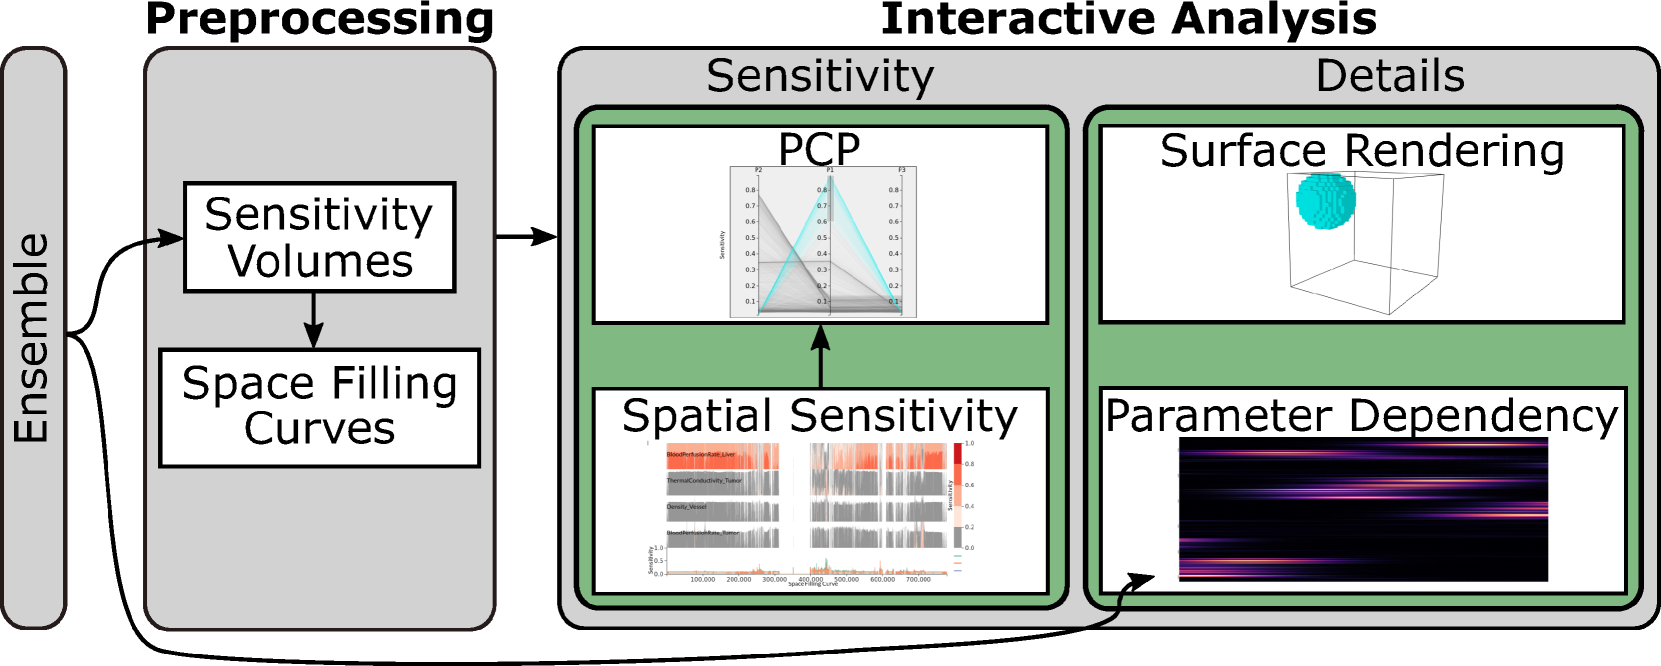
Sensitivity analyses of simulation ensembles determine how simulation parameters influence the simulation's outcome. Commonly, one global numerical sensitivity value is computed per simulation parameter. However, when considering 3D spatial simulations, the analysis of localized sensitivities in different spatial regions is of importance in many applications. For analyzing the spatial variation of parameter sensitivity, one needs to compute a spatial sensitivity scalar field per simulation parameter. Given $n$ simulation parameters, we obtain multi-field data consisting of $n$ scalar fields when considering all simulation parameters. We propose an interactive visual analytics solution to analyze the multi-field sensitivity data. It supports the investigation of how strongly and in what way individual parameters influence the simulation outcome, in which spatial regions this is happening, and what the interplay of the simulation parameters is. Its central component is an overview visualization of all sensitivity fields that avoids 3D occlusions by linearizing the data using an adapted scheme of data-driven space-filling curves. The spatial sensitivity values are visualized in a combination of a Horizon Graph and a line chart. We validate our approach by applying it to synthetic and real-world ensemble data.
Read more8/9/2024

0
Global Sensitivity Analysis of Uncertain Parameters in Bayesian Networks
Rafael Ballester-Ripoll, Manuele Leonelli
Traditionally, the sensitivity analysis of a Bayesian network studies the impact of individually modifying the entries of its conditional probability tables in a one-at-a-time (OAT) fashion. However, this approach fails to give a comprehensive account of each inputs' relevance, since simultaneous perturbations in two or more parameters often entail higher-order effects that cannot be captured by an OAT analysis. We propose to conduct global variance-based sensitivity analysis instead, whereby $n$ parameters are viewed as uncertain at once and their importance is assessed jointly. Our method works by encoding the uncertainties as $n$ additional variables of the network. To prevent the curse of dimensionality while adding these dimensions, we use low-rank tensor decomposition to break down the new potentials into smaller factors. Last, we apply the method of Sobol to the resulting network to obtain $n$ global sensitivity indices. Using a benchmark array of both expert-elicited and learned Bayesian networks, we demonstrate that the Sobol indices can significantly differ from the OAT indices, thus revealing the true influence of uncertain parameters and their interactions.
Read more6/11/2024

0
A Large-Scale Sensitivity Analysis on Latent Embeddings and Dimensionality Reductions for Text Spatializations
Daniel Atzberger, Tim Cech, Willy Scheibel, Jurgen Dollner, Michael Behrisch, Tobias Schreck
The semantic similarity between documents of a text corpus can be visualized using map-like metaphors based on two-dimensional scatterplot layouts. These layouts result from a dimensionality reduction on the document-term matrix or a representation within a latent embedding, including topic models. Thereby, the resulting layout depends on the input data and hyperparameters of the dimensionality reduction and is therefore affected by changes in them. Furthermore, the resulting layout is affected by changes in the input data and hyperparameters of the dimensionality reduction. However, such changes to the layout require additional cognitive efforts from the user. In this work, we present a sensitivity study that analyzes the stability of these layouts concerning (1) changes in the text corpora, (2) changes in the hyperparameter, and (3) randomness in the initialization. Our approach has two stages: data measurement and data analysis. First, we derived layouts for the combination of three text corpora and six text embeddings and a grid-search-inspired hyperparameter selection of the dimensionality reductions. Afterward, we quantified the similarity of the layouts through ten metrics, concerning local and global structures and class separation. Second, we analyzed the resulting 42817 tabular data points in a descriptive statistical analysis. From this, we derived guidelines for informed decisions on the layout algorithm and highlight specific hyperparameter settings. We provide our implementation as a Git repository at https://github.com/hpicgs/Topic-Models-and-Dimensionality-Reduction-Sensitivity-Study and results as Zenodo archive at https://doi.org/10.5281/zenodo.12772898.
Read more7/26/2024

0
SpatialTouch: Exploring Spatial Data Visualizations in Cross-reality
Lixiang Zhao, Tobias Isenberg, Fuqi Xie, Hai-Ning Liang, Lingyun Yu
We propose and study a novel cross-reality environment that seamlessly integrates a monoscopic 2D surface (an interactive screen with touch and pen input) with a stereoscopic 3D space (an augmented reality HMD) to jointly host spatial data visualizations. This innovative approach combines the best of two conventional methods of displaying and manipulating spatial 3D data, enabling users to fluidly explore diverse visual forms using tailored interaction techniques. Providing such effective 3D data exploration techniques is pivotal for conveying its intricate spatial structures -- often at multiple spatial or semantic scales -- across various application domains and requiring diverse visual representations for effective visualization. To understand user reactions to our new environment, we began with an elicitation user study, in which we captured their responses and interactions. We observed that users adapted their interaction approaches based on perceived visual representations, with natural transitions in spatial awareness and actions while navigating across the physical surface. Our findings then informed the development of a design space for spatial data exploration in cross-reality. We thus developed cross-reality environments tailored to three distinct domains: for 3D molecular structure data, for 3D point cloud data, and for 3D anatomical data. In particular, we designed interaction techniques that account for the inherent features of interactions in both spaces, facilitating various forms of interaction, including mid-air gestures, touch interactions, pen interactions, and combinations thereof, to enhance the users' sense of presence and engagement. We assessed the usability of our environment with biologists, focusing on its use for domain research. In addition, we evaluated our interaction transition designs with virtual and mixed-reality experts to gather further insights.
Read more7/23/2024