Chronoblox: Chronophotographic Sequential Graph Visualization

0
📶
Sign in to get full access
Overview
- Chronoblox is a system for visualizing dynamic graphs
- It uses a common embedding space to represent all time periods, allowing for the visualization of both local and global dynamics
- The paper reviews the embedding and spatialization strategies used in Chronoblox, and explains how it translates micro to meso structural evolution visually
- The approach is evaluated using a synthetic network and a real-world retweet network
Plain English Explanation
Chronoblox is a tool that helps you understand how a network, like a social network, changes over time. It takes a series of snapshots of the network at different points in time and maps them all onto a single visualization. This allows you to see both the local changes happening in different parts of the network, as well as the overall, global dynamics.
The key idea is to find a way to represent all the time periods in a common space, so that you can compare them directly. Chronoblox does this through a special kind of data embedding, which converts the network structure into a numerical representation that preserves important relationships. This embedded data is then spatially arranged to create the final visualization.
By seeing both the local and global changes in the network over time, Chronoblox can give you a more complete understanding of how the system is evolving. For example, you might be able to spot emerging communities or identify key influencers that are driving the network dynamics. This could be useful in a variety of applications, such as analyzing social media activity or understanding the spread of information.
Technical Explanation
Chronoblox uses a two-step process to visualize dynamic graphs. First, it embeds the graph structure from each time snapshot into a common numerical representation. This is done using techniques like Chronos to capture both the local and global properties of the evolving network.
Second, Chronoblox spatially arranges these embedded representations onto a single visualization. The goal is to position the time snapshots such that both the micro-level changes (e.g. node movements) and the meso-level structural evolution (e.g. community formation) are apparent. This is similar to approaches used in temporal graph visualization and multi-scale graph analysis.
The paper evaluates Chronoblox on both a synthetic network and a real-world retweet network. The results demonstrate that the system is able to effectively convey the dynamic changes in graph structure over time, allowing users to gain insights into the evolving network.
Critical Analysis
The paper provides a high-level overview of the Chronoblox system, but leaves out some important details. For example, it does not go into the specifics of the embedding and spatialization algorithms used, which would be necessary to fully evaluate the technical approach. Additionally, the evaluation is relatively limited, focusing only on a single synthetic network and one real-world dataset.
While the authors claim that Chronoblox can represent both local and global dynamics, it's unclear how well the system performs when faced with larger, more complex networks. The scalability and generalizability of the approach could be further explored.
It would also be interesting to see how Chronoblox compares to other dynamic graph visualization techniques, both in terms of the insights it can provide and the user experience. A more thorough comparison to related work would help situate the contribution of this research.
Overall, the Chronoblox system shows promise, but additional research and validation would be needed to fully assess its capabilities and limitations. Readers are encouraged to think critically about the tradeoffs and consider how the tool might be applied or extended in their own contexts of interest.
Conclusion
Chronoblox is a novel system for visualizing dynamic graphs, which aims to represent both local and global changes in network structure over time. By embedding graph snapshots into a common visualization space, the tool allows users to gain insights into the evolving relationships and patterns within the data.
While the paper provides a high-level overview of the Chronoblox approach, further research is needed to fully evaluate its technical merits and practical applications. Nonetheless, the core idea of using a unified embedding to capture temporal dynamics is an intriguing one, with potential implications for a variety of fields that deal with complex, evolving network data.
As the volume and complexity of networked data continues to grow, tools like Chronoblox may become increasingly valuable for making sense of these dynamic systems. By bridging the gap between micro and meso-level changes, the system could help unlock new understandings and lead to impactful discoveries.
This summary was produced with help from an AI and may contain inaccuracies - check out the links to read the original source documents!
Related Papers
📶
0
Chronoblox: Chronophotographic Sequential Graph Visualization
Quentin Lobb'e (CMB), Camille Roth (CAMS, CMB), Lena Mangold (CAMS, CMB)
We introduce Chronoblox, a system for visualizing dynamic graphs. Chronoblox consists of a chronophotography of a sequence of graph snapshots based on a single embedding space common to all time periods. The goal of Chronoblox is to project all snapshots onto a common visualization space so as to represent both local and global dynamics at a glance. In this short paper, we review both the embedding and spatialization strategies. We then explain the way in which Chronoblox translates micro to meso structural evolution visually. We finally evaluate our approach using a synthetic network before illustrating it on a real world retweet network.
Read more5/14/2024
0
ChronoMagic-Bench: A Benchmark for Metamorphic Evaluation of Text-to-Time-lapse Video Generation
Shenghai Yuan, Jinfa Huang, Yongqi Xu, Yaoyang Liu, Shaofeng Zhang, Yujun Shi, Ruijie Zhu, Xinhua Cheng, Jiebo Luo, Li Yuan
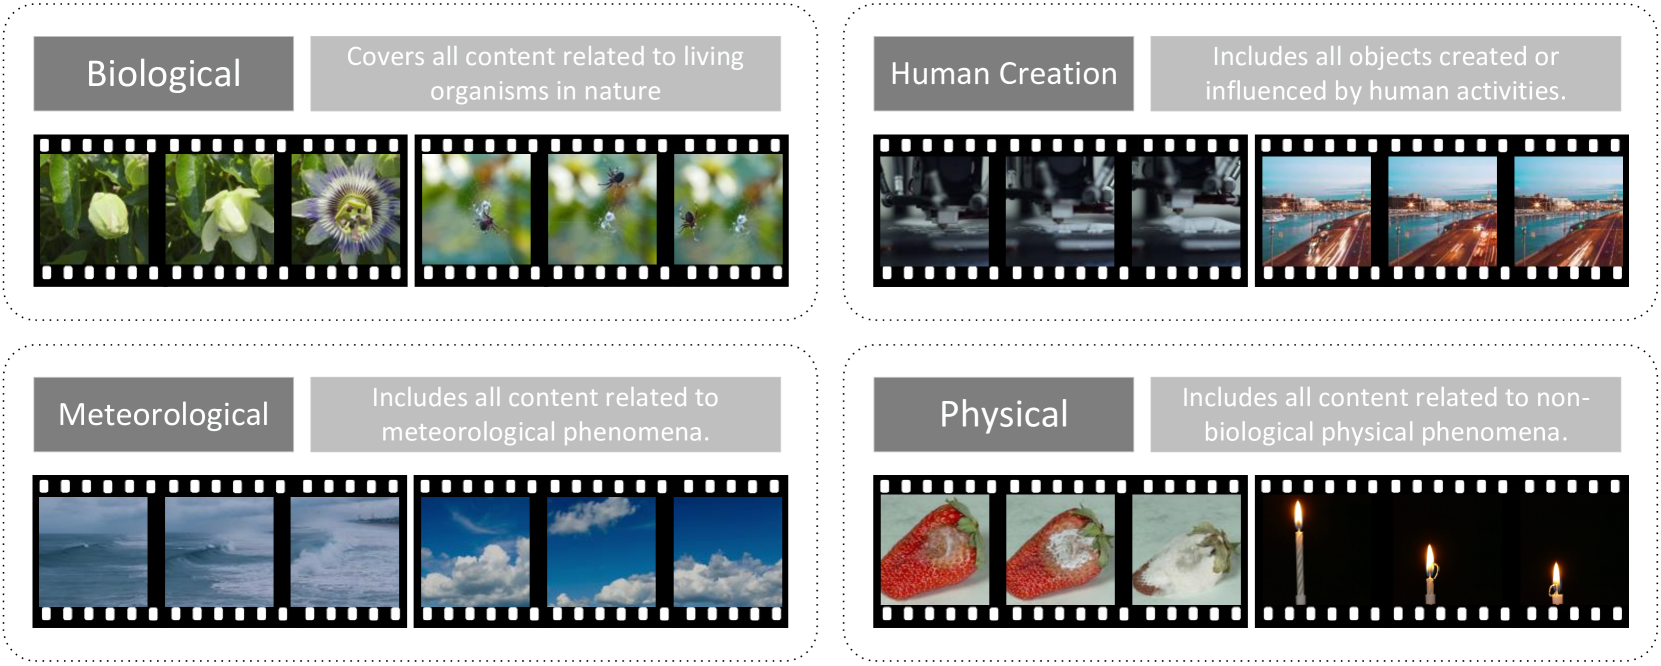
We propose a novel text-to-video (T2V) generation benchmark, ChronoMagic-Bench, to evaluate the temporal and metamorphic capabilities of the T2V models (e.g. Sora and Lumiere) in time-lapse video generation. In contrast to existing benchmarks that focus on the visual quality and textual relevance of generated videos, ChronoMagic-Bench focuses on the model's ability to generate time-lapse videos with significant metamorphic amplitude and temporal coherence. The benchmark probes T2V models for their physics, biology, and chemistry capabilities, in a free-form text query. For these purposes, ChronoMagic-Bench introduces 1,649 prompts and real-world videos as references, categorized into four major types of time-lapse videos: biological, human-created, meteorological, and physical phenomena, which are further divided into 75 subcategories. This categorization comprehensively evaluates the model's capacity to handle diverse and complex transformations. To accurately align human preference with the benchmark, we introduce two new automatic metrics, MTScore and CHScore, to evaluate the videos' metamorphic attributes and temporal coherence. MTScore measures the metamorphic amplitude, reflecting the degree of change over time, while CHScore assesses the temporal coherence, ensuring the generated videos maintain logical progression and continuity. Based on the ChronoMagic-Bench, we conduct comprehensive manual evaluations of ten representative T2V models, revealing their strengths and weaknesses across different categories of prompts, and providing a thorough evaluation framework that addresses current gaps in video generation research. Moreover, we create a large-scale ChronoMagic-Pro dataset, containing 460k high-quality pairs of 720p time-lapse videos and detailed captions ensuring high physical pertinence and large metamorphic amplitude.
Read more6/27/2024
144
Chronos: Learning the Language of Time Series
Abdul Fatir Ansari, Lorenzo Stella, Caner Turkmen, Xiyuan Zhang, Pedro Mercado, Huibin Shen, Oleksandr Shchur, Syama Sundar Rangapuram, Sebastian Pineda Arango, Shubham Kapoor, Jasper Zschiegner, Danielle C. Maddix, Hao Wang, Michael W. Mahoney, Kari Torkkola, Andrew Gordon Wilson, Michael Bohlke-Schneider, Yuyang Wang
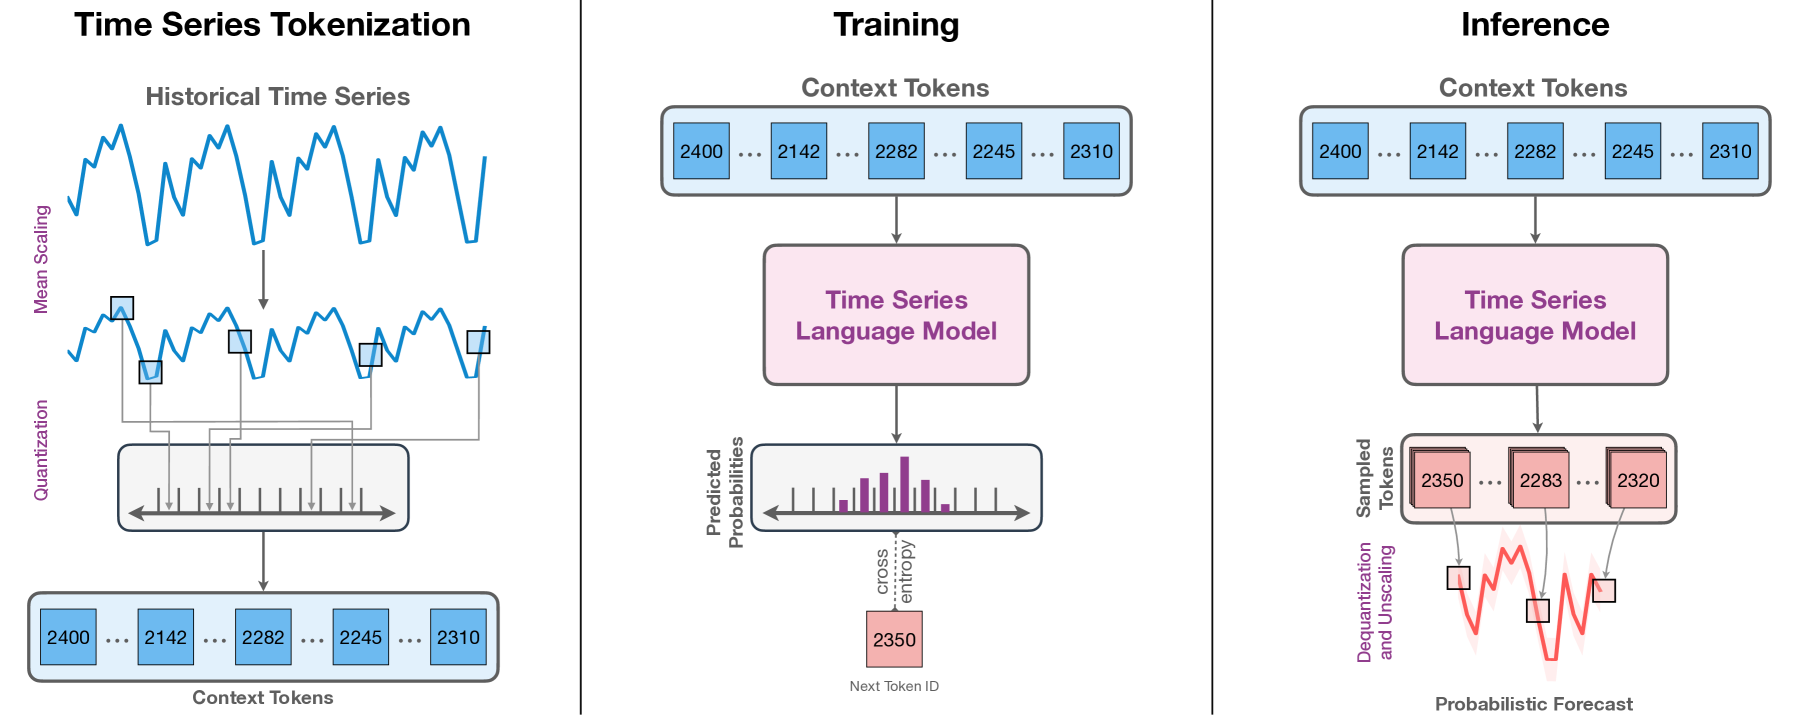
We introduce Chronos, a simple yet effective framework for pretrained probabilistic time series models. Chronos tokenizes time series values using scaling and quantization into a fixed vocabulary and trains existing transformer-based language model architectures on these tokenized time series via the cross-entropy loss. We pretrained Chronos models based on the T5 family (ranging from 20M to 710M parameters) on a large collection of publicly available datasets, complemented by a synthetic dataset that we generated via Gaussian processes to improve generalization. In a comprehensive benchmark consisting of 42 datasets, and comprising both classical local models and deep learning methods, we show that Chronos models: (a) significantly outperform other methods on datasets that were part of the training corpus; and (b) have comparable and occasionally superior zero-shot performance on new datasets, relative to methods that were trained specifically on them. Our results demonstrate that Chronos models can leverage time series data from diverse domains to improve zero-shot accuracy on unseen forecasting tasks, positioning pretrained models as a viable tool to greatly simplify forecasting pipelines.
Read more5/3/2024
🔗
0
TimeFlows: Visualizing Process Chronologies from Vast Collections of Heterogeneous Information Objects
Max Lonysa Muller, Erik Saaman, Jan Martijn E. M. van der Werf, Charles Jeurgens, Hajo A. Reijers
In many fact-finding investigations, notably parliamentary inquiries, process chronologies are created to reconstruct how a controversial policy or decision came into existence. Current approaches, like timelines, lack the expressiveness to represent the variety of relations in which historic events may link to the overall chronology. This obfuscates the nature of the interdependence among the events, and the texts from which they are distilled. Based on explorative interviews with expert analysts, we propose an extended, rich set of relationships. We describe how these can be visualized as TimeFlows. We provide an example of such a visualization by illustrating the Childcare Benefits Scandal -- an affair that deeply affected Dutch politics in recent years. This work extends the scope of existing process discovery research into the direction of unveiling non-repetitive processes from unstructured information objects.
Read more5/6/2024