Exploration of the search space of Gaussian graphical models for paired data

0
📊
Sign in to get full access
Overview
- This paper explores the problem of learning a Gaussian graphical model from paired data, where observations come from two dependent groups sharing the same variables.
- The authors introduce a novel order between models, called the "twin order," and show that this order results in a distributive lattice structure for the model space, unlike the traditional model inclusion lattice.
- They provide efficient rules for computing the neighbors of a model under the twin order, which can be leveraged to improve the performance of both greedy and Bayesian model search procedures.
- The authors implement a stepwise backward elimination procedure and evaluate its performance through simulations, as well as apply it to learning a brain network from fMRI data.
Plain English Explanation
Graphical models are a powerful tool for understanding the relationships between different variables. In this paper, the researchers consider a specific type of graphical model called a Gaussian graphical model, which is used to model data that follows a Gaussian (normal) distribution.
The key twist in this research is that the data comes from two related groups, such as the left and right hemispheres of the brain. The researchers want to learn a single graphical model that can capture the relationships between variables that are shared across these two groups.
To do this, they introduce a new way of organizing and searching the space of possible graphical models, called the "twin order." This twin order has some nice mathematical properties that make the search more efficient than the traditional approach, called the "model inclusion lattice."
The researchers then use this twin order to develop a stepwise procedure for learning the graphical model from the paired data. They test this procedure on simulated data, as well as on real brain imaging data, where the two groups correspond to the left and right hemispheres.
The main significance of this work is that it provides a more effective way to learn graphical models from paired data, which is a common scenario in many scientific and medical applications, such as comparing brain networks between different groups or learning causal models from multiple distributions.
Technical Explanation
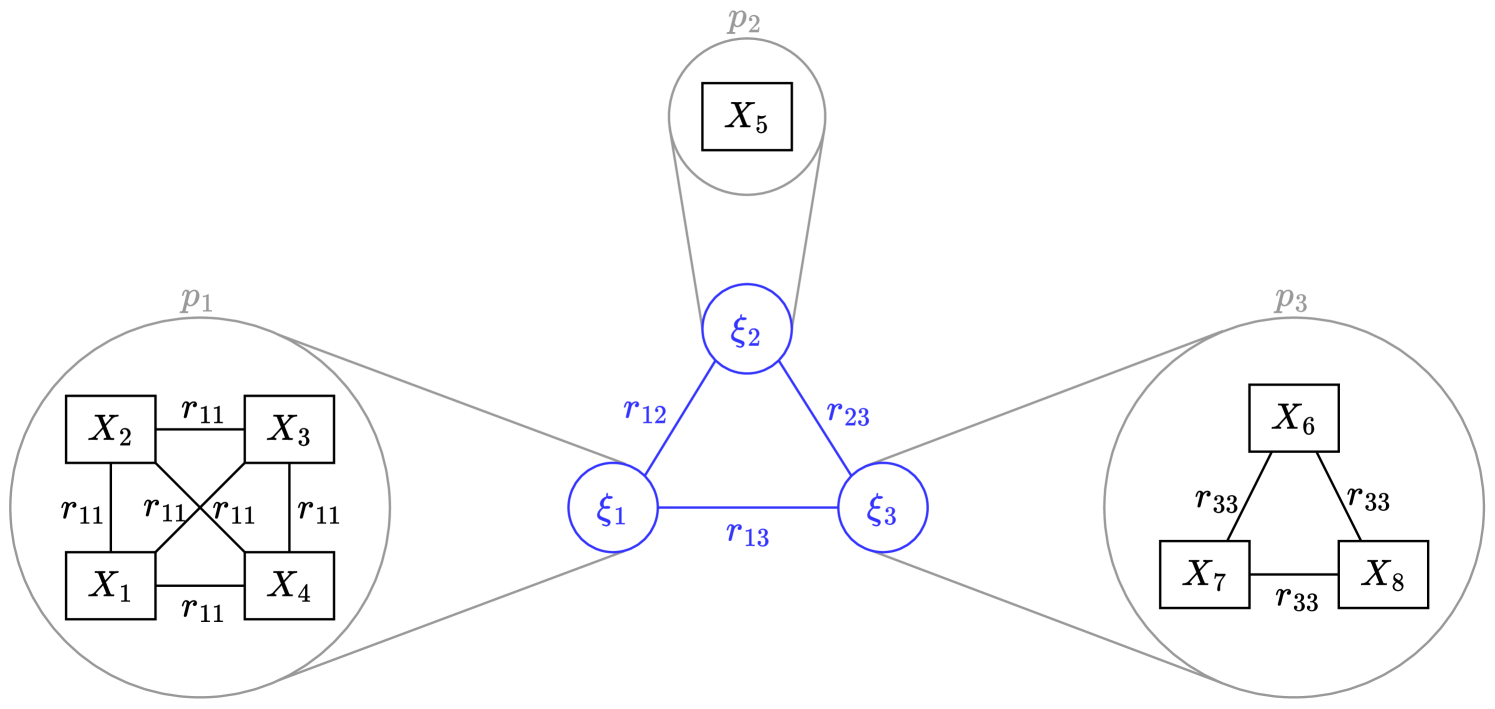
The researchers consider the problem of learning a Gaussian graphical model from paired data, where the observations come from two dependent groups that share the same variables. They focus on a family of "coloured" Gaussian graphical models that are specifically suited for this paired data scenario.
Traditionally, graphical models are ordered by the "model inclusion lattice," where one model is a submodel of another if it has fewer edges. The authors introduce a novel order called the "twin order," which has some desirable properties. Specifically, they show that under the twin order, the model space forms a distributive lattice, unlike the model inclusion lattice.
Furthermore, the researchers provide efficient rules for computing the neighbors of a model under the twin order. These neighbor computations are more efficient than the same operations in the model inclusion lattice, and can be leveraged to improve the performance of both greedy and Bayesian model search procedures.
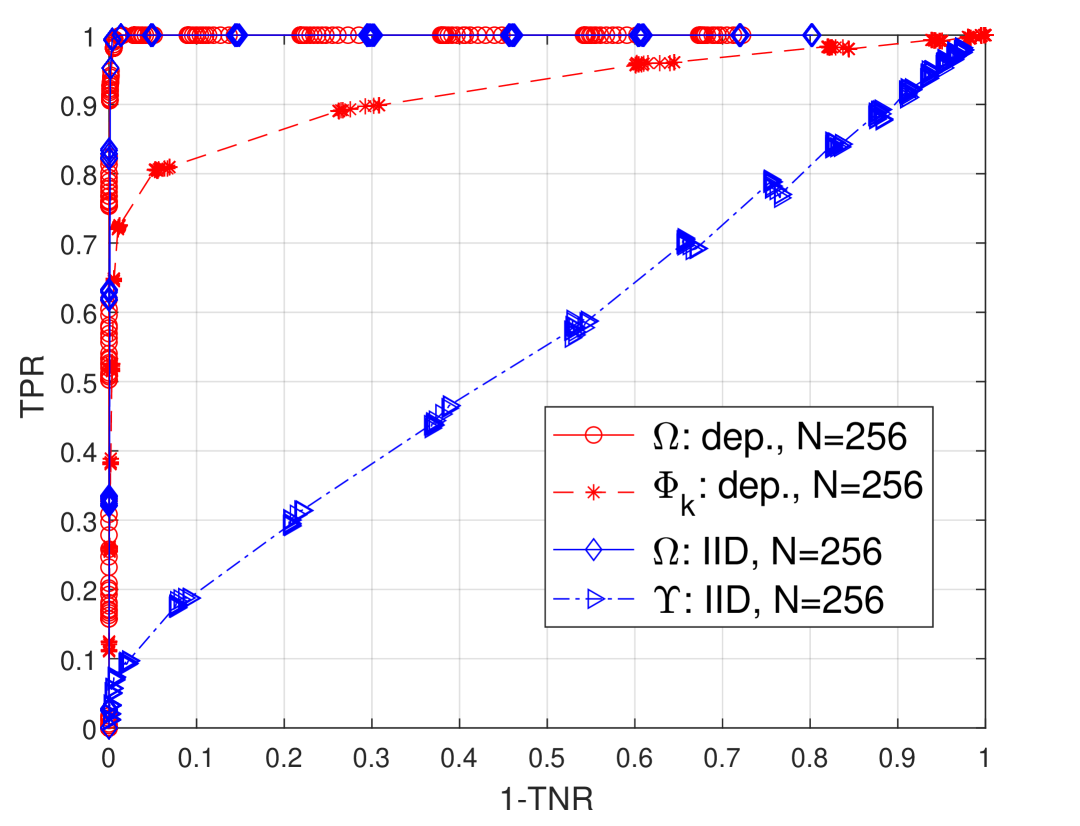
To demonstrate the benefits of their approach, the authors implement a stepwise backward elimination procedure and evaluate its performance through simulations. They also apply the procedure to learn a brain network from fMRI data, where the two groups correspond to the left and right hemispheres of the brain.
Critical Analysis
The paper presents a novel and potentially impactful approach to learning Gaussian graphical models from paired data. The introduction of the "twin order" and the associated efficient neighbor computations are promising developments that could significantly improve the scalability and effectiveness of graphical model learning algorithms.
One potential limitation of the research is that it is focused on the specific case of Gaussian graphical models. It would be interesting to see if the twin order and the associated computational benefits could be extended to other types of graphical models, such as those based on copulas or polynomial models.
Additionally, the authors do not provide a rigorous theoretical analysis of the statistical properties of their proposed method, such as generalization bounds or convergence rates. While the empirical results are promising, a deeper theoretical understanding of the method's statistical guarantees would be valuable.
Overall, this paper makes an important contribution to the field of graphical model learning, particularly in the context of paired data. The introduction of the twin order and the associated computational improvements are likely to have a significant impact on the development of more efficient and scalable graphical model learning algorithms.
Conclusion
This paper presents a novel approach to learning Gaussian graphical models from paired data, where observations come from two dependent groups sharing the same variables. The key innovation is the introduction of the "twin order," which leads to a distributive lattice structure for the model space and more efficient computations of model neighbors.
The authors demonstrate the benefits of their approach through simulations and an application to learning a brain network from fMRI data. While the focus is on Gaussian graphical models, the general principles of the twin order and the associated computational improvements could potentially be extended to other types of graphical models, opening up interesting avenues for future research.
Overall, this work represents an important contribution to the field of graphical model learning, with the potential to significantly improve the efficiency and effectiveness of algorithms for learning graphical models from paired data, which is a common scenario in many scientific and medical applications.
This summary was produced with help from an AI and may contain inaccuracies - check out the links to read the original source documents!
Related Papers
📊
0
Exploration of the search space of Gaussian graphical models for paired data
Alberto Roverato, Dung Ngoc Nguyen
We consider the problem of learning a Gaussian graphical model in the case where the observations come from two dependent groups sharing the same variables. We focus on a family of coloured Gaussian graphical models specifically suited for the paired data problem. Commonly, graphical models are ordered by the submodel relationship so that the search space is a lattice, called the model inclusion lattice. We introduce a novel order between models, named the twin order. We show that, embedded with this order, the model space is a lattice that, unlike the model inclusion lattice, is distributive. Furthermore, we provide the relevant rules for the computation of the neighbours of a model. The latter are more efficient than the same operations in the model inclusion lattice, and are then exploited to achieve a more efficient exploration of the search space. These results can be applied to improve the efficiency of both greedy and Bayesian model search procedures. Here we implement a stepwise backward elimination procedure and evaluate its performance by means of simulations. Finally, the procedure is applied to learn a brain network from fMRI data where the two groups correspond to the left and right hemispheres, respectively.
Read more4/16/2024
0
Clusterpath Gaussian Graphical Modeling
D. J. W. Touw, A. Alfons, P. J. F. Groenen, I. Wilms
Graphical models serve as effective tools for visualizing conditional dependencies between variables. However, as the number of variables grows, interpretation becomes increasingly difficult, and estimation uncertainty increases due to the large number of parameters relative to the number of observations. To address these challenges, we introduce the Clusterpath estimator of the Gaussian Graphical Model (CGGM) that encourages variable clustering in the graphical model in a data-driven way. Through the use of a clusterpath penalty, we group variables together, which in turn results in a block-structured precision matrix whose block structure remains preserved in the covariance matrix. We present a computationally efficient implementation of the CGGM estimator by using a cyclic block coordinate descent algorithm. In simulations, we show that CGGM not only matches, but oftentimes outperforms other state-of-the-art methods for variable clustering in graphical models. We also demonstrate CGGM's practical advantages and versatility on a diverse collection of empirical applications.
Read more7/2/2024

0
Sparse Graphical Linear Dynamical Systems
Emilie Chouzenoux, Victor Elvira
Time-series datasets are central in machine learning with applications in numerous fields of science and engineering, such as biomedicine, Earth observation, and network analysis. Extensive research exists on state-space models (SSMs), which are powerful mathematical tools that allow for probabilistic and interpretable learning on time series. Learning the model parameters in SSMs is arguably one of the most complicated tasks, and the inclusion of prior knowledge is known to both ease the interpretation but also to complicate the inferential tasks. Very recent works have attempted to incorporate a graphical perspective on some of those model parameters, but they present notable limitations that this work addresses. More generally, existing graphical modeling tools are designed to incorporate either static information, focusing on statistical dependencies among independent random variables (e.g., graphical Lasso approach), or dynamic information, emphasizing causal relationships among time series samples (e.g., graphical Granger approaches). However, there are no joint approaches combining static and dynamic graphical modeling within the context of SSMs. This work proposes a novel approach to fill this gap by introducing a joint graphical modeling framework that bridges the graphical Lasso model and a causal-based graphical approach for the linear-Gaussian SSM. We present DGLASSO (Dynamic Graphical Lasso), a new inference method within this framework that implements an efficient block alternating majorization-minimization algorithm. The algorithm's convergence is established by departing from modern tools from nonlinear analysis. Experimental validation on various synthetic data showcases the effectiveness of the proposed model and inference algorithm.
Read more6/17/2024
0
Learning Sparse High-Dimensional Matrix-Valued Graphical Models From Dependent Data
Jitendra K Tugnait
We consider the problem of inferring the conditional independence graph (CIG) of a sparse, high-dimensional, stationary matrix-variate Gaussian time series. All past work on high-dimensional matrix graphical models assumes that independent and identically distributed (i.i.d.) observations of the matrix-variate are available. Here we allow dependent observations. We consider a sparse-group lasso-based frequency-domain formulation of the problem with a Kronecker-decomposable power spectral density (PSD), and solve it via an alternating direction method of multipliers (ADMM) approach. The problem is bi-convex which is solved via flip-flop optimization. We provide sufficient conditions for local convergence in the Frobenius norm of the inverse PSD estimators to the true value. This result also yields a rate of convergence. We illustrate our approach using numerical examples utilizing both synthetic and real data.
Read more5/1/2024