Exploratory Visual Analysis for Increasing Data Readiness in Artificial Intelligence Projects

0

Sign in to get full access
Overview
- Explores the role of exploratory visual analysis in increasing data readiness for artificial intelligence (AI) projects
- Examines the challenges of data preparation and how visual analysis can help address them
- Proposes a framework for integrating exploratory visual analysis into the AI project lifecycle
Plain English Explanation
Preparing data for use in AI projects can be a complex and time-consuming task. Exploratory Visual Analysis for Increasing Data Readiness in Artificial Intelligence Projects explores how visual analysis techniques can help make this process more efficient and effective.
The paper argues that by using visual analysis tools, AI teams can better understand and prepare their data for use in machine learning models. This can involve identifying data quality issues, discovering patterns and relationships, and getting a more holistic view of the data. By addressing these challenges upfront, the researchers suggest that AI projects can be more successful and impactful.
The paper presents a framework for integrating exploratory visual analysis into the AI project lifecycle, from the initial data exploration phase to model deployment and monitoring. This includes using techniques like data visualization, interactive dashboards, and automated data quality checks to continuously assess and improve the readiness of the data.
Overall, the research highlights the importance of data preparation and the role that visual analysis can play in making AI projects more robust and reliable. By focusing on data readiness, the paper suggests that AI teams can increase the chances of their models being successful in real-world applications.
Technical Explanation
The paper Exploratory Visual Analysis for Increasing Data Readiness in Artificial Intelligence Projects proposes a framework for incorporating exploratory visual analysis into the AI project lifecycle to address challenges in data preparation.
The authors argue that data preparation is a critical but often overlooked step in AI projects, and that visual analysis techniques can help teams better understand and validate their data. The framework they present includes four key components:
- Data Exploration: Using interactive visualizations and dashboards to explore the dataset, identify patterns, and uncover potential issues.
- Data Quality Assessment: Applying automated data quality checks and visual anomaly detection to identify and address data quality problems.
- Data Transformation and Curation: Leveraging visual tools to clean, transform, and curate the data for use in machine learning models.
- Continuous Monitoring: Continuously monitoring the data and models through visual analytics to detect drift and maintain data readiness.
The paper also discusses the importance of user-centric design in the visual analysis tools, ensuring that they are tailored to the needs and workflows of the AI teams.
Through a series of case studies and examples, the authors demonstrate how this framework can be applied in practice to improve the data readiness and overall success of AI projects.
Critical Analysis
The paper provides a compelling argument for the value of exploratory visual analysis in AI projects, highlighting the critical role of data preparation and the challenges that teams often face in this area.
One strength of the research is the comprehensive framework it presents for integrating visual analysis throughout the AI project lifecycle. This holistic approach recognizes the need for continuous data monitoring and adaptation, rather than a one-time data preparation exercise.
However, the paper also acknowledges some limitations and areas for further research. For example, the authors note that the effectiveness of the framework may depend on the specific domain and use case, and that more empirical studies are needed to validate its impact.
Additionally, the paper does not delve deeply into the technical details of the visual analysis techniques and tools that can be employed. While it provides a high-level overview, a more in-depth discussion of the state-of-the-art in this area could have further strengthened the research.
Overall, the paper makes a strong case for the importance of data readiness and the role that exploratory visual analysis can play in achieving it. By encouraging AI teams to think critically about their data and continuously monitor its quality, the proposed framework has the potential to increase the reliability and impact of AI systems in real-world applications.
Conclusion
"Exploratory Visual Analysis for Increasing Data Readiness in Artificial Intelligence Projects" highlights the critical role of data preparation in the success of AI projects and proposes a framework for integrating exploratory visual analysis to address this challenge.
The research demonstrates how visual analysis techniques can help AI teams better understand, validate, and curate their data, leading to more robust and reliable machine learning models. By embedding these practices throughout the project lifecycle, the authors argue that AI teams can increase the data readiness and overall impact of their work.
While the paper acknowledges some limitations and areas for further research, it makes a compelling case for the value of visual analysis in the AI development process. As AI continues to be applied in more domains, the insights and recommendations from this work can help ensure that the underlying data is well-prepared and ready for real-world deployment.
This summary was produced with help from an AI and may contain inaccuracies - check out the links to read the original source documents!
Related Papers
0
Exploratory Visual Analysis for Increasing Data Readiness in Artificial Intelligence Projects
Mattias Tiger, Daniel Jakobsson, Anders Ynnerman, Fredrik Heintz, Daniel Jonsson
We present experiences and lessons learned from increasing data readiness of heterogeneous data for artificial intelligence projects using visual analysis methods. Increasing the data readiness level involves understanding both the data as well as the context in which it is used, which are challenges well suitable to visual analysis. For this purpose, we contribute a mapping between data readiness aspects and visual analysis techniques suitable for different data types. We use the defined mapping to increase data readiness levels in use cases involving time-varying data, including numerical, categorical, and text. In addition to the mapping, we extend the data readiness concept to better take aspects of the task and solution into account and explicitly address distribution shifts during data collection time. We report on our experiences in using the presented visual analysis techniques to aid future artificial intelligence projects in raising the data readiness level.
Read more9/9/2024
0
Data Readiness for AI: A 360-Degree Survey
Kaveen Hiniduma, Suren Byna, Jean Luca Bez
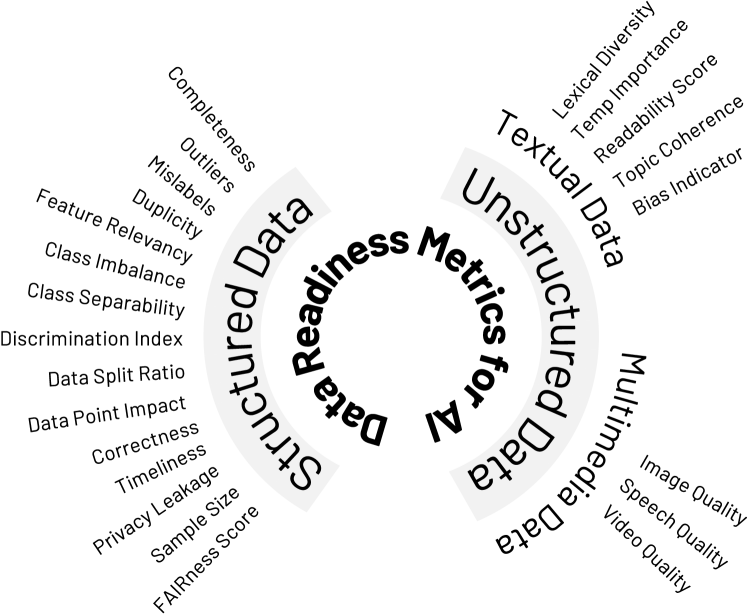
Data are the critical fuel for Artificial Intelligence (AI) models. Poor quality data produces inaccurate and ineffective AI models that may lead to incorrect or unsafe use. Checking for data readiness is a crucial step in improving data quality. Numerous R&D efforts have been spent on improving data quality. However, standardized metrics for evaluating data readiness for use in AI training are still evolving. In this study, we perform a comprehensive survey of metrics used for verifying AI's data readiness. This survey examines more than 120 papers that are published by ACM Digital Library, IEEE Xplore, other reputable journals, and articles published on the web by prominent AI experts. This survey aims to propose a taxonomy of data readiness for AI (DRAI) metrics for structured and unstructured datasets. We anticipate that this taxonomy can lead to new standards for DRAI metrics that would be used for enhancing the quality and accuracy of AI training and inference.
Read more4/10/2024
📊
0
Guided By AI: Navigating Trust, Bias, and Data Exploration in AI-Guided Visual Analytics
Sunwoo Ha, Shayan Monadjemi, Alvitta Ottley
The increasing integration of artificial intelligence (AI) in visual analytics (VA) tools raises vital questions about the behavior of users, their trust, and the potential of induced biases when provided with guidance during data exploration. We present an experiment where participants engaged in a visual data exploration task while receiving intelligent suggestions supplemented with four different transparency levels. We also modulated the difficulty of the task (easy or hard) to simulate a more tedious scenario for the analyst. Our results indicate that participants were more inclined to accept suggestions when completing a more difficult task despite the AI's lower suggestion accuracy. Moreover, the levels of transparency tested in this study did not significantly affect suggestion usage or subjective trust ratings of the participants. Additionally, we observed that participants who utilized suggestions throughout the task explored a greater quantity and diversity of data points. We discuss these findings and the implications of this research for improving the design and effectiveness of AI-guided VA tools.
Read more4/24/2024

0
Bridging Quantitative and Qualitative Methods for Visualization Research: A Data/Semantics Perspective in Light of Advanced AI
Daniel Weiskopf
This paper revisits the role of quantitative and qualitative methods in visualization research in the context of advancements in artificial intelligence (AI). The focus is on how we can bridge between the different methods in an integrated process of analyzing user study data. To this end, a process model of - potentially iterated - semantic enrichment and transformation of data is proposed. This joint perspective of data and semantics facilitates the integration of quantitative and qualitative methods. The model is motivated by examples of own prior work, especially in the area of eye tracking user studies and coding data-rich observations. Finally, there is a discussion of open issues and research opportunities in the interplay between AI, human analyst, and qualitative and quantitative methods for visualization research.
Read more9/12/2024