Fostering Creative Visualisation Skills Through Data-Art Exhibitions

0

Sign in to get full access
Overview
- This paper explores how data-art exhibitions can be used to foster creative visualization skills in students.
- The authors describe a series of lectures, activities, and study tasks aimed at developing students' abilities to create and interpret data visualizations.
- The research was conducted in the context of an undergraduate course on data visualization and digital art.
Plain English Explanation
The paper discusses an approach to teaching data visualization that involves creating and displaying "data-art" - artistic visualizations of data. The researchers believe that this hands-on, creative approach can help students develop stronger skills in interpreting and creating data visualizations.
The course they describe includes a series of lectures that introduce students to data visualization concepts and techniques. Students then participate in activities where they create their own data-art pieces. Finally, they are assigned study tasks that challenge them to analyze and interpret data visualizations.
The goal is to give students a more authentic learning experience with data visualization, going beyond just learning the technical skills to also developing an artistic, creative approach. This, the authors argue, can lead to better overall visualization abilities.
Technical Explanation
The paper describes a university-level course that aims to develop students' data visualization skills through a combination of lectures, activities, and study tasks. The lectures cover foundational concepts and techniques in data visualization, while the activities have students create their own "data-art" pieces - artistic visualizations of data.
The data-art creation process involves students selecting a dataset, determining how to visually represent the data in an aesthetic way, and then producing a final artwork to be displayed in an exhibition. This hands-on, creative approach is contrasted with more traditional data visualization instruction, which may focus more on technical skills like using visualization software.
In addition to the data-art activities, the course also includes study tasks where students analyze and interpret existing data visualizations. These tasks are designed to build students' critical thinking and evaluation abilities related to data visualization.
The researchers argue that this holistic approach, encompassing both the production and consumption of data visualizations, can lead to improved overall visualization literacy and fluency among students. They present qualitative feedback from students indicating that the course was effective in developing their creative and analytical skills in this domain.
Critical Analysis
The paper presents a compelling approach to teaching data visualization that goes beyond just technical training and seeks to develop students' creative and critical thinking abilities. The emphasis on "data-art" production is an intriguing way to engage students and get them to think about visualization in a more imaginative, expressive way.
That said, the research is relatively limited in scope, being based on a single university course. More empirical evidence would be needed to fully validate the effectiveness of this approach, such as comparing learning outcomes to those of more traditional data visualization instruction.
Additionally, the paper does not delve deeply into potential limitations or challenges of the data-art methodology. For example, it's unclear how well this approach would scale to larger class sizes, or how it might need to be adapted for students with diverse backgrounds and skill levels.
Further research could also explore ways to better integrate the data-art creation and visualization analysis components of the course, to ensure students are making strong connections between the two. Encouraging more peer feedback and critique of the data-art pieces, for instance, could be one way to strengthen the critical thinking aspect.
Overall, though, the paper presents a creative and promising direction for data visualization education that merits further exploration and validation through additional studies.
Conclusion
This paper describes an innovative approach to teaching data visualization that goes beyond just technical training, and instead aims to foster students' creative and critical thinking abilities. By having students create "data-art" pieces and analyze existing visualizations, the course seeks to provide a more authentic and engaging learning experience.
The authors argue that this holistic, hands-on approach can lead to improved overall visualization literacy and fluency among students. While the research is limited in scope, it presents an intriguing direction for data visualization education that merits further exploration and validation.
This summary was produced with help from an AI and may contain inaccuracies - check out the links to read the original source documents!
Related Papers
0
Fostering Creative Visualisation Skills Through Data-Art Exhibitions
Jonathan C. Roberts
Data-art exhibitions offer a unique and real-world setting to foster creative visualisation skills among students. They serve as real-world platform for students to display their work, bridging the gap between classroom learning and professional practice. Students must develop a technical solution, grasp the context, and produce work that is appropriate for public presentation. This scenario helps to encourage innovative thinking, engagement with the topic, and helps to enhance technical proficiency. We present our implementation of a data-art exhibition within a computing curriculum, for third-year degree-level students. Students create art-based visualisations from selected datasets and present their work in a public exhibition. We have used this initiative over the course of two academic years with different cohorts, and reflect on its impact on student learning and creativity.
Read more8/30/2024
0
Creating Data Art: Authentic Learning and Visualisation Exhibition
Jonathan C. Roberts
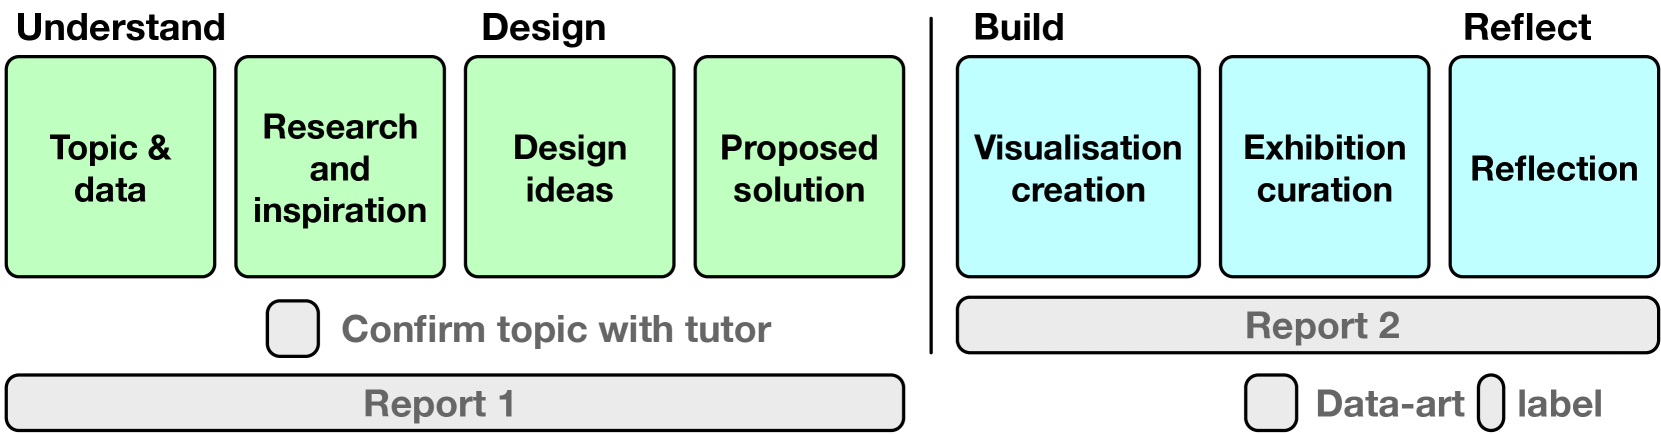
We present an authentic learning task designed for computing students, centred on the creation of data-art visualisations from chosen datasets for a public exhibition. This exhibition was showcased in the cinema foyer for two weeks in June, providing a real-world platform for students to display their work. Over the course of two years, we implemented this active learning task with two different cohorts of students. In this paper, we share our experiences and insights from these activities, highlighting the impact on student engagement and learning outcomes. We also provide a detailed description of the seven individual tasks that learners must perform: topic and data selection and analysis, research and art inspiration, design conceptualisation, proposed solution, visualisation creation, exhibition curation, and reflection. By integrating these tasks, students not only develop technical skills but also gain practical experience in presenting their work to a public audience, bridging the gap between academic learning and professional practice.
Read more8/15/2024

0
Engaging Data-Art: Conducting a Public Hands-On Workshop
Jonathan C. Roberts
Data-art blends visualisation, data science, and artistic expression. It allows people to transform information and data into exciting and interesting visual narratives. Hosting a public data-art hands-on workshop enables participants to engage with data and learn fundamental visualisation techniques. However, being a public event, it presents a range of challenges. We outline our approach to organising and conducting a public workshop, that caters to a wide age range, from children to adults. We divide the tutorial into three sections, focusing on data, sketching skills and visualisation. We place emphasis on public engagement, and ensure that participants have fun while learning new skills.
Read more8/12/2024

0
Considering Visualization Example Galleries
Junran Yang, Andrew McNutt, Leilani Battle
Example galleries are often used to teach, document, and advertise visually-focused domain-specific languages and libraries, such as those producing visualizations, diagrams, or webpages. Despite their ubiquity, there is no consensus on the role of example galleries, let alone what the best practices might be for their creation or curation. To understand gallery meaning and usage, we interviewed the creators (N=11) and users (N=9) of prominent visualization-adjacent tools. From these interviews we synthesized strategies and challenges for gallery curation and management (e.g. weighing the costs/benefits of adding new examples and trade-offs in richness vs ease of use), highlighted the differences between planned and actual gallery usage (e.g. opportunistic reuse vs search-engine optimization), and reflected on parts of the gallery design space not explored (e.g. highlighting the potential of tool assistance). We found that galleries are multi-faceted structures whose form and content are motivated to accommodate different usages--ranging from marketing material to test suite to extended documentation. This work offers a foundation for future support tools by characterizing gallery design and management, as well as by highlighting challenges and opportunities in the space (such as how more diverse galleries make reuse tasks simpler, but complicate upkeep).
Read more7/31/2024