Considering Visualization Example Galleries

0

Sign in to get full access
Overview
- This paper examines the role of visualization example galleries in the design and development of data visualizations.
- The authors investigate how these galleries are used, the challenges they pose, and potential improvements.
- The findings provide insights for designers, researchers, and tool developers working on visualization systems.
Plain English Explanation
Visualization example galleries are collections of sample visualizations that are often included in data visualization tools and software. These galleries serve as a starting point for users, allowing them to explore different visualization types and get inspiration for their own projects.
However, the authors found that these galleries can also present some challenges. For example, the vast number of examples can be overwhelming, making it difficult for users to quickly find relevant and useful visualizations. Additionally, the examples may not always align with the user's specific data or goals, requiring significant customization to be applicable.
To address these issues, the authors suggest potential improvements to visualization example galleries. This could include better organization and filtering capabilities, as well as the ability to connect examples to the underlying data or use case. By making these galleries more tailored and user-friendly, they can better support the data visualization design process.
Technical Explanation
The paper presents a study that investigates the role of visualization example galleries in the design and development of data visualizations. The authors conducted a mixed-methods study, including an online survey and interviews with data visualization practitioners, to understand how these galleries are used, the challenges they pose, and potential improvements.
The survey results revealed that visualization example galleries are widely used, with 92% of respondents reporting that they use them regularly. However, the authors also identified several challenges, such as the difficulty in finding relevant examples, the limited ability to customize or adapt the examples, and the lack of connection between the examples and the user's specific data or use case.
To further explore these issues, the authors conducted in-depth interviews with 12 data visualization practitioners. The interviews provided deeper insights into the participants' experiences and highlighted the need for improved organization, filtering, and customization capabilities within visualization example galleries.
Based on the study findings, the authors propose several suggestions for enhancing visualization example galleries. These include the ability to filter examples by data characteristics, visualization types, or use cases, as well as the option to connect examples to the underlying data or specific user requirements.
Critical Analysis
The paper provides a comprehensive exploration of the role and challenges of visualization example galleries, drawing on both quantitative and qualitative data. The authors' mixed-methods approach, combining a broad online survey with in-depth interviews, offers a well-rounded understanding of the topic.
One potential limitation of the study is the relatively small sample size for the interviews, which may limit the generalizability of the findings. Additionally, the paper does not delve deeply into the broader ecosystem of data visualization tools and the role of example galleries within that context.
Despite these minor caveats, the paper offers valuable insights and suggestions that can inform the design and development of more effective visualization example galleries. By addressing the identified challenges, such as improved organization and customization capabilities, visualization tool creators can better support users in the data visualization design process.
Conclusion
This paper sheds light on the crucial role of visualization example galleries in the data visualization ecosystem. The study findings underscore the widespread use of these galleries, as well as the need for enhancements to better meet the needs of data visualization practitioners.
The authors' recommendations for improved organization, filtering, and connection to user-specific data and use cases provide a roadmap for tool developers and researchers to enhance the utility of visualization example galleries. By addressing these areas, the design and development of data visualizations can be better supported, ultimately leading to more effective and impactful visual communication of information.
This summary was produced with help from an AI and may contain inaccuracies - check out the links to read the original source documents!
Related Papers
0
Considering Visualization Example Galleries
Junran Yang, Andrew McNutt, Leilani Battle
Example galleries are often used to teach, document, and advertise visually-focused domain-specific languages and libraries, such as those producing visualizations, diagrams, or webpages. Despite their ubiquity, there is no consensus on the role of example galleries, let alone what the best practices might be for their creation or curation. To understand gallery meaning and usage, we interviewed the creators (N=11) and users (N=9) of prominent visualization-adjacent tools. From these interviews we synthesized strategies and challenges for gallery curation and management (e.g. weighing the costs/benefits of adding new examples and trade-offs in richness vs ease of use), highlighted the differences between planned and actual gallery usage (e.g. opportunistic reuse vs search-engine optimization), and reflected on parts of the gallery design space not explored (e.g. highlighting the potential of tool assistance). We found that galleries are multi-faceted structures whose form and content are motivated to accommodate different usages--ranging from marketing material to test suite to extended documentation. This work offers a foundation for future support tools by characterizing gallery design and management, as well as by highlighting challenges and opportunities in the space (such as how more diverse galleries make reuse tasks simpler, but complicate upkeep).
Read more7/31/2024

0
Fostering Creative Visualisation Skills Through Data-Art Exhibitions
Jonathan C. Roberts
Data-art exhibitions offer a unique and real-world setting to foster creative visualisation skills among students. They serve as real-world platform for students to display their work, bridging the gap between classroom learning and professional practice. Students must develop a technical solution, grasp the context, and produce work that is appropriate for public presentation. This scenario helps to encourage innovative thinking, engagement with the topic, and helps to enhance technical proficiency. We present our implementation of a data-art exhibition within a computing curriculum, for third-year degree-level students. Students create art-based visualisations from selected datasets and present their work in a public exhibition. We have used this initiative over the course of two academic years with different cohorts, and reflect on its impact on student learning and creativity.
Read more8/30/2024
0
Creating Data Art: Authentic Learning and Visualisation Exhibition
Jonathan C. Roberts
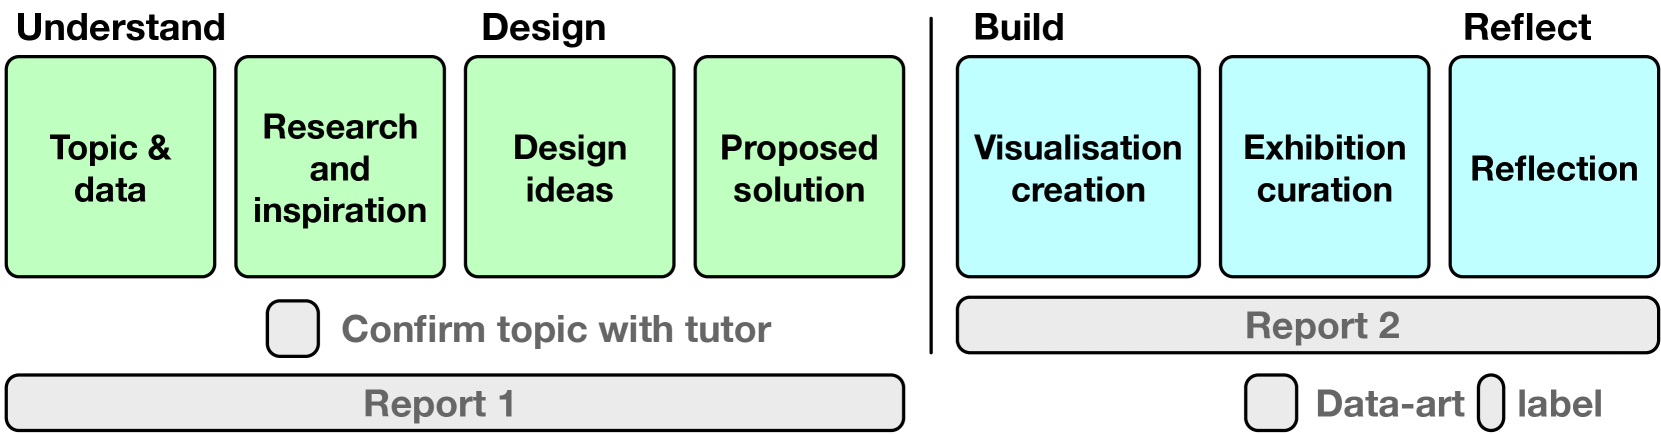
We present an authentic learning task designed for computing students, centred on the creation of data-art visualisations from chosen datasets for a public exhibition. This exhibition was showcased in the cinema foyer for two weeks in June, providing a real-world platform for students to display their work. Over the course of two years, we implemented this active learning task with two different cohorts of students. In this paper, we share our experiences and insights from these activities, highlighting the impact on student engagement and learning outcomes. We also provide a detailed description of the seven individual tasks that learners must perform: topic and data selection and analysis, research and art inspiration, design conceptualisation, proposed solution, visualisation creation, exhibition curation, and reflection. By integrating these tasks, students not only develop technical skills but also gain practical experience in presenting their work to a public audience, bridging the gap between academic learning and professional practice.
Read more8/15/2024

0
DaVE -- A Curated Database of Visualization Examples
Jens Koenen, Marvin Petersen, Christoph Garth, Tim Gerrits
Visualization, from simple line plots to complex high-dimensional visual analysis systems, has established itself throughout numerous domains to explore, analyze, and evaluate data. Applying such visualizations in the context of simulation science where High-Performance Computing (HPC) produces ever-growing amounts of data that is more complex, potentially multidimensional, and multimodal, takes up resources and a high level of technological experience often not available to domain experts. In this work, we present DaVE -- a curated database of visualization examples, which aims to provide state-of-the-art and advanced visualization methods that arise in the context of HPC applications. Based on domain- or data-specific descriptors entered by the user, DaVE provides a list of appropriate visualization techniques, each accompanied by descriptions, examples, references, and resources. Sample code, adaptable container templates, and recipes for easy integration in HPC applications can be downloaded for easy access to high-fidelity visualizations. While the database is currently filled with a limited number of entries based on a broad evaluation of needs and challenges of current HPC users, DaVE is designed to be easily extended by experts from both the visualization and HPC communities.
Read more8/7/2024