From Delays to Densities: Exploring Data Uncertainty through Speech, Text, and Visualization

0

Sign in to get full access
Overview
- This paper explores how to effectively communicate data uncertainty through speech, text, and visualization.
- The researchers investigate different techniques for representing and conveying the inherent uncertainty in data to users.
- The study examines how various presentation methods impact user understanding and decision-making around uncertain information.
Plain English Explanation
The paper looks at ways to better communicate the uncertainty present in data. Data is often messy and imperfect, with inherent ambiguities and unknowns. But when this data is presented through things like charts and graphs, that uncertainty can get lost or obscured. The researchers in this study wanted to find better ways to make users aware of the underlying uncertainties so they can make more informed decisions.
They tested different approaches, like using speech, text, and visual cues to convey the degree of certainty or uncertainty in the data. For example, instead of just showing a chart, they explored adding verbal descriptions or visual indicators to highlight areas where the data is less reliable. The goal was to give users a more complete picture of the data, warts and all, so they have a better sense of what they can and can't confidently conclude from the information.
By making uncertainty more transparent, the researchers hope to help people become more discerning consumers of data and avoid over-interpreting results or making decisions based on incomplete information. It's about fostering a more nuanced understanding of data and its limitations.
Technical Explanation
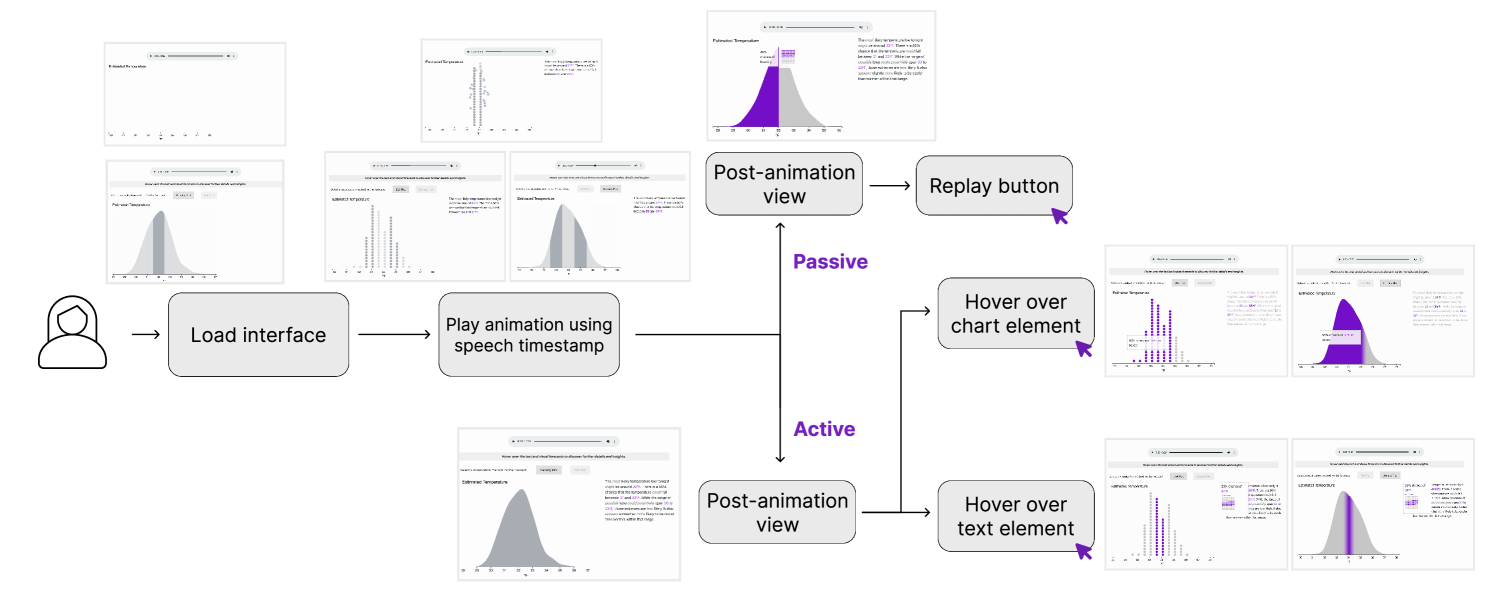
The paper presents a series of experiments exploring how different techniques for representing data uncertainty impact user comprehension and decision-making. The researchers tested three main modalities: speech, text, and visualization.
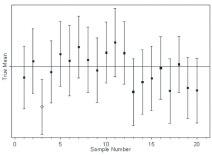
In the speech experiment, participants listened to audio descriptions of data that either did or did not include verbal cues about uncertainty (e.g. "the data suggests" vs. "the data clearly shows"). The text experiment presented participants with written summaries that varied in how much they qualified the level of certainty. And the visualization experiment used graphical elements like error bars or shaded regions to convey the spread or ambiguity in the data.
Across these studies, the researchers measured factors like participant recall, judgement confidence, and willingness to act on the information. The results indicate that explicitly highlighting uncertainty, whether through language or visual design, can enhance user awareness and lead to more cautious, nuanced interpretations of the data.
Critical Analysis
The paper provides a thoughtful exploration of an important issue in data communication and visualization. Conveying the inherent ambiguity and limitations of data is crucial, yet often overlooked, in the design of information displays. The empirical studies offer valuable insights into how different presentation techniques can shape user understanding and decision-making.
That said, the experiments were relatively constrained in scope, focused on specific datasets and visualization types. More research would be needed to assess the generalizability of the findings across a wider range of data contexts and visualization styles. Additionally, the paper does not delve deeply into the cognitive and psychological factors underlying how people process and interpret uncertain information.
Another potential limitation is that the studies primarily assessed immediate comprehension and judgements, but did not examine longer-term impacts or real-world behaviors. It would be worthwhile to investigate how uncertainty representation affects things like information retention, decision quality, and trust over time.
Overall, this work makes a solid contribution to the growing body of research on uncertainty visualization and communication. The insights provide a useful foundation for further exploration and refinement of techniques to help users better understand the nuances and limitations of data.
Conclusion
This paper tackles the important challenge of how to effectively communicate data uncertainty to users. Through a series of empirical studies, the researchers demonstrate that explicitly representing ambiguity and limitations, whether through language or visual cues, can enhance user awareness and lead to more cautious, nuanced interpretations of data.
By making uncertainty more transparent, this work aims to help people become more discerning consumers of information and avoid over-interpreting incomplete or unreliable data. The findings offer valuable guidance for the design of data visualizations and other information displays that foster a more balanced, realistic understanding of what the data can and cannot confidently tell us.
Ultimately, this research contributes to the broader effort to improve data literacy and empower people to make more informed decisions in the face of inherent uncertainties. As data continues to pervade more aspects of our lives, developing robust methods for conveying its limitations will only grow in importance.
This summary was produced with help from an AI and may contain inaccuracies - check out the links to read the original source documents!
Related Papers
0
From Delays to Densities: Exploring Data Uncertainty through Speech, Text, and Visualization
Chase Stokes, Chelsea Sanker, Bridget Cogley, Vidya Setlur
Understanding and communicating data uncertainty is crucial for making informed decisions in sectors like finance and healthcare. Previous work has explored how to express uncertainty in various modes. For example, uncertainty can be expressed visually with quantile dot plots or linguistically with hedge words and prosody. Our research aims to systematically explore how variations within each mode contribute to communicating uncertainty to the user; this allows us to better understand each mode's affordances and limitations. We completed an exploration of the uncertainty design space based on pilot studies and ran two crowdsourced experiments examining how speech, text, and visualization modes and variants within them impact decision-making with uncertain data. Visualization and text were most effective for rational decision-making, though text resulted in lower confidence. Speech garnered the highest trust despite sometimes leading to risky decisions. Results from these studies indicate meaningful trade-offs among modes of information and encourage exploration of multimodal data representations.
Read more4/15/2024

0
Voicing Uncertainty: How Speech, Text, and Visualizations Influence Decisions with Data Uncertainty
Chase Stokes, Chelsea Sanker, Bridget Cogley, Vidya Setlur
Understanding and communicating data uncertainty is crucial for informed decision-making across various domains, including finance, healthcare, and public policy. This study investigates the impact of gender and acoustic variables on decision-making, confidence, and trust through a crowdsourced experiment. We compared visualization-only representations of uncertainty to text-forward and speech-forward bimodal representations, including multiple synthetic voices across gender. Speech-forward representations led to an increase in risky decisions, and text-forward representations led to lower confidence. Contrary to prior work, speech-forward forecasts did not receive higher ratings of trust. Higher normalized pitch led to a slight increase in decision confidence, but other voice characteristics had minimal impact on decisions and trust. An exploratory analysis of accented speech showed consistent results with the main experiment and additionally indicated lower trust ratings for information presented in Indian and Kenyan accents. The results underscore the importance of considering acoustic and contextual factors in presentation of data uncertainty.
Read more8/19/2024
0
Mixing Modes: Active and Passive Integration of Speech, Text, and Visualization for Communicating Data Uncertainty
Chase Stokes, Chelsea Sanker, Bridget Cogley, Vidya Setlur
Interpreting uncertain data can be difficult, particularly if the data presentation is complex. We investigate the efficacy of different modalities for representing data and how to combine the strengths of each modality to facilitate the communication of data uncertainty. We implemented two multimodal prototypes to explore the design space of integrating speech, text, and visualization elements. A preliminary evaluation with 20 participants from academic and industry communities demonstrates that there exists no one-size-fits-all approach for uncertainty communication strategies; rather, the effectiveness of conveying uncertain data is intertwined with user preferences and situational context, necessitating a more refined, multimodal strategy for future interface design.
Read more4/15/2024
0
Enhancing Uncertainty Communication in Time Series Predictions: Insights and Recommendations
Apoorva Karagappa, Pawandeep Kaur Betz, Jonas Gilg, Moritz Zeumer, Andreas Gerndt, Bernhard Preim
As the world increasingly relies on mathematical models for forecasts in different areas, effective communication of uncertainty in time series predictions is important for informed decision making. This study explores how users estimate probabilistic uncertainty in time series predictions under different variants of line charts depicting uncertainty. It examines the role of individual characteristics and the influence of user-reported metrics on uncertainty estimations. By addressing these aspects, this paper aims to enhance the understanding of uncertainty visualization and for improving communication in time series forecast visualizations and the design of prediction data dashboards.As the world increasingly relies on mathematical models for forecasts in different areas, effective communication of uncertainty in time series predictions is important for informed decision making. This study explores how users estimate probabilistic uncertainty in time series predictions under different variants of line charts depicting uncertainty. It examines the role of individual characteristics and the influence of user-reported metrics on uncertainty estimations. By addressing these aspects, this paper aims to enhance the understanding of uncertainty visualization and for improving communication in time series forecast visualizations and the design of prediction data dashboards.
Read more8/23/2024