Improving multidimensional projection quality with user-specific metrics and optimal scaling

0

Sign in to get full access
Overview
- Personalized multidimensional projections
- User-specific quality metrics
- High-dimensional data visualization
Plain English Explanation
Visualizing high-dimensional data can be challenging, as the complexity of the original data makes it difficult to represent in a clear and meaningful way on a 2D or 3D screen. Multidimensional projection techniques like t-SNE and UMAP have been developed to address this problem by reducing the dimensionality of the data while preserving important relationships.
However, these techniques often rely on generic quality metrics that may not align with the specific interests and preferences of individual users. This paper proposes a new approach that allows users to customize the projection quality metrics to better suit their needs and goals. By optimizing the projection based on user-specific criteria, the resulting visualization can provide more meaningful and insightful representations of the high-dimensional data.
The paper also explores how to efficiently compute these personalized projections in an online setting, allowing users to interactively explore and manipulate the data visualizations in real-time. This can be particularly useful for tasks like data exploration, anomaly detection, and decision-making, where the ability to quickly and dynamically adjust the projection can lead to valuable insights.
Technical Explanation
The key idea of this paper is to develop a framework for generating personalized multidimensional projections that optimize for user-specific quality metrics. The authors start by formalizing the problem of dimensionality reduction as an optimization task, where the goal is to find a low-dimensional representation of the data that best preserves the user's preferred relationships and structures.
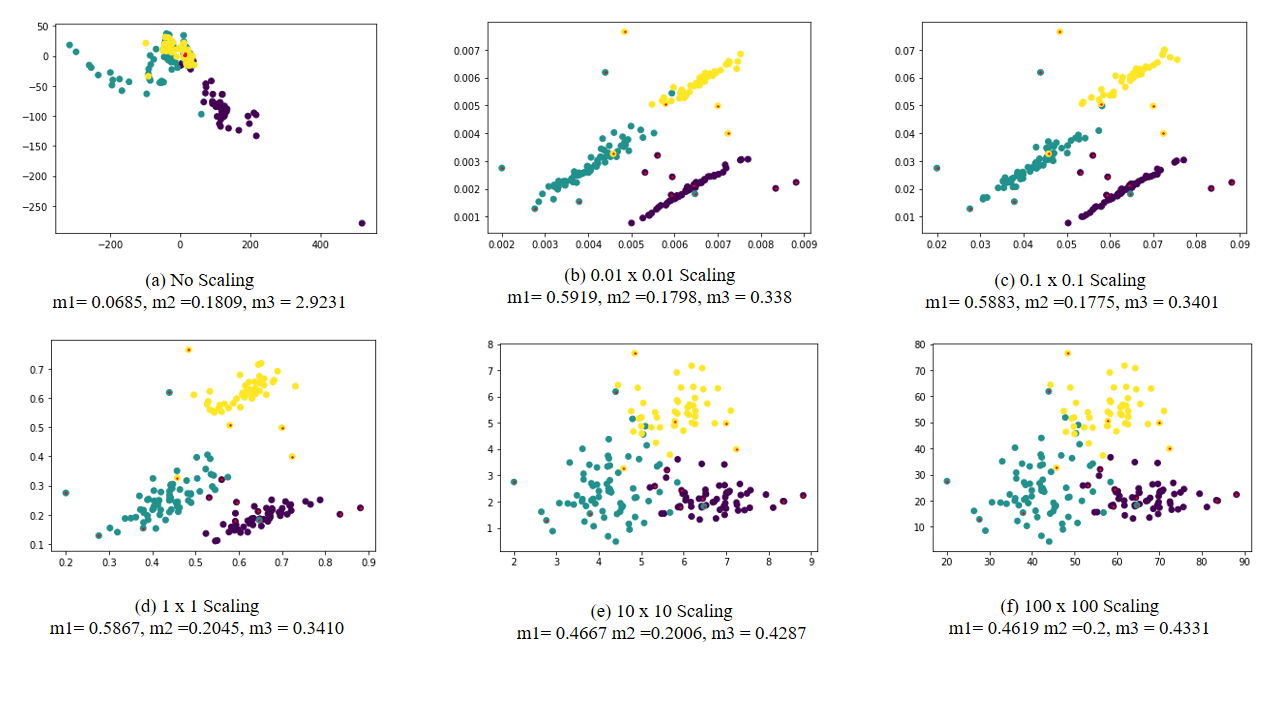
To achieve this, the authors introduce a novel technique called "optimal scaling," which allows the user to specify a set of target distances or similarities between data points. The projection algorithm then iteratively adjusts the low-dimensional representation to minimize the difference between the target and projected distances, effectively tailoring the visualization to the user's preferences.
The paper also presents an efficient algorithm for computing these personalized projections in an online setting, enabling real-time interaction and exploration of the high-dimensional data. This is achieved by leveraging techniques like approximate nearest neighbor search and incremental updates to the projection, allowing the visualization to be updated quickly as the user interacts with the data.
The authors evaluate their approach on several benchmark datasets and user studies, demonstrating that the personalized projections can indeed lead to more informative and insightful visualizations compared to standard dimensionality reduction techniques.
Critical Analysis
The proposed framework for generating personalized multidimensional projections is a promising approach to addressing the challenges of high-dimensional data visualization. By allowing users to customize the quality metrics used to optimize the projection, the technique can produce visualizations that are better aligned with the user's specific interests and goals.
However, the paper does not extensively explore the potential limitations or drawbacks of this approach. For example, it would be interesting to see how the personalized projections perform when the user's preferences are not well-defined or change over time. Additionally, the paper does not discuss the computational complexity of the optimal scaling algorithm, which could be a concern for very large or high-dimensional datasets.
Another area for further research could be the integration of this approach with other dimensionality reduction techniques, such as those that leverage clustering or manifold approximation. Combining personalized optimization with these more advanced dimensionality reduction methods could potentially lead to even more powerful and insightful data visualizations.
Overall, the work presented in this paper represents an important step forward in the field of high-dimensional data visualization, and the authors' ideas and techniques could have significant implications for a wide range of data exploration and analysis tasks.
Conclusion
This paper introduces a novel approach to improving the quality of multidimensional projections by allowing users to customize the optimization criteria used to generate the low-dimensional representations. By leveraging user-specific quality metrics and an efficient optimal scaling algorithm, the technique can produce visualizations that are better aligned with the user's interests and goals.
The ability to interactively explore and manipulate these personalized projections in real-time is a particularly valuable feature, as it can lead to valuable insights and decision-making support in a wide range of application domains. While the paper does not fully address all the potential limitations and challenges, the authors' work represents an important contribution to the field of high-dimensional data visualization and offers promising avenues for further research and development.
This summary was produced with help from an AI and may contain inaccuracies - check out the links to read the original source documents!
Related Papers
0
Improving multidimensional projection quality with user-specific metrics and optimal scaling
Maniru Ibrahim
The growing prevalence of high-dimensional data has fostered the development of multidimensional projection (MP) techniques, such as t-SNE, UMAP, and LAMP, for data visualization and exploration. However, conventional MP methods typically employ generic quality metrics, neglecting individual user preferences. This study proposes a new framework that tailors MP techniques based on user-specific quality criteria, enhancing projection interpretability. Our approach combines three visual quality metrics, stress, neighborhood preservation, and silhouette score, to create a composite metric for a precise MP evaluation. We then optimize the projection scale by maximizing the composite metric value. We conducted an experiment involving two users with different projection preferences, generating projections using t-SNE, UMAP, and LAMP. Users rate projections according to their criteria, producing two training sets. We derive optimal weights for each set and apply them to other datasets to determine the best projections per user. Our findings demonstrate that personalized projections effectively capture user preferences, fostering better data exploration and enabling more informed decision-making. This user-centric approach promotes advancements in multidimensional projection techniques that accommodate diverse user preferences and enhance interpretability.
Read more7/24/2024
0
A new visual quality metric for Evaluating the performance of multidimensional projections
Maniru Ibrahim, Thales Vieira
Multidimensional projections (MP) are among the most essential approaches in the visual analysis of multidimensional data. It transforms multidimensional data into two-dimensional representations that may be shown as scatter plots while preserving their similarity with the original data. Human visual perception is frequently used to evaluate the quality of MP. In this work, we propose to study and improve on a well-known map called Local Affine Multidimensional Projection (LAMP), which takes a multidimensional instance and embeds it in Cartesian space via moving least squares deformation. We propose a new visual quality metric based on human perception. The new metric combines three previously used metrics: silhouette coefficient, neighborhood preservation, and silhouette ratio. We show that the proposed metric produces more precise results in analyzing the quality of MP than other previously used metrics. Finally, we describe an algorithm that attempts to overcome a limitation of the LAMP method which requires a similar scale for control points and their counterparts in the Cartesian space.
Read more7/24/2024
📉
0
CBMAP: Clustering-based manifold approximation and projection for dimensionality reduction
Berat Dogan
Dimensionality reduction methods are employed to decrease data dimensionality, either to enhance machine learning performance or to facilitate data visualization in two or three-dimensional spaces. These methods typically fall into two categories: feature selection and feature transformation. Feature selection retains significant features, while feature transformation projects data into a lower-dimensional space, with linear and nonlinear methods. While nonlinear methods excel in preserving local structures and capturing nonlinear relationships, they may struggle with interpreting global structures and can be computationally intensive. Recent algorithms, such as the t-SNE, UMAP, TriMap, and PaCMAP prioritize preserving local structures, often at the expense of accurately representing global structures, leading to clusters being spread out more in lower-dimensional spaces. Moreover, these methods heavily rely on hyperparameters, making their results sensitive to parameter settings. To address these limitations, this study introduces a clustering-based approach, namely CBMAP (Clustering-Based Manifold Approximation and Projection), for dimensionality reduction. CBMAP aims to preserve both global and local structures, ensuring that clusters in lower-dimensional spaces closely resemble those in high-dimensional spaces. Experimental evaluations on benchmark datasets demonstrate CBMAP's efficacy, offering speed, scalability, and minimal reliance on hyperparameters. Importantly, CBMAP enables low-dimensional projection of test data, addressing a critical need in machine learning applications. CBMAP is made freely available at https://github.com/doganlab/cbmap and can be installed from the Python Package Directory (PyPI) software repository with the command pip install cbmap.
Read more9/17/2024
0
Approximate UMAP allows for high-rate online visualization of high-dimensional data streams
Peter Wassenaar, Pierre Guetschel, Michael Tangermann
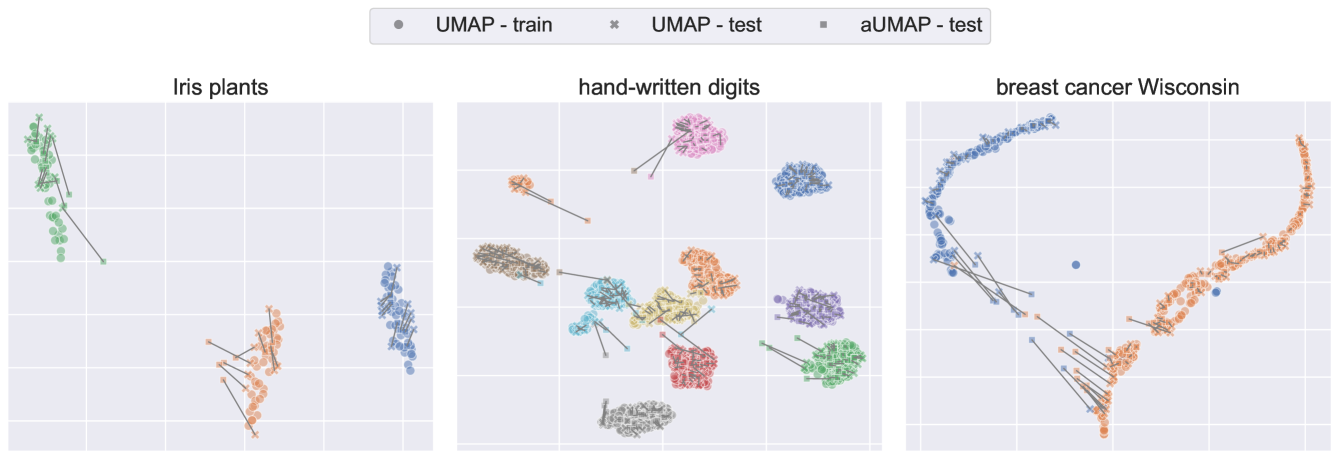
In the BCI field, introspection and interpretation of brain signals are desired for providing feedback or to guide rapid paradigm prototyping but are challenging due to the high noise level and dimensionality of the signals. Deep neural networks are often introspected by transforming their learned feature representations into 2- or 3-dimensional subspace visualizations using projection algorithms like Uniform Manifold Approximation and Projection (UMAP). Unfortunately, these methods are computationally expensive, making the projection of data streams in real-time a non-trivial task. In this study, we introduce a novel variant of UMAP, called approximate UMAP (aUMAP). It aims at generating rapid projections for real-time introspection. To study its suitability for real-time projecting, we benchmark the methods against standard UMAP and its neural network counterpart parametric UMAP. Our results show that approximate UMAP delivers projections that replicate the projection space of standard UMAP while decreasing projection speed by an order of magnitude and maintaining the same training time.
Read more4/8/2024