SynChart: Synthesizing Charts from Language Models

0
Sign in to get full access
Overview
- The paper presents SynChart, a system that can generate high-quality charts from natural language inputs using large language models.
- It introduces a new dataset called the SynChart dataset, which is used to train and evaluate SynChart.
- The paper discusses the design rationales behind SynChart and provides a technical explanation of its architecture and evaluation.
- It also includes a critical analysis of the limitations and potential future research directions.
Plain English Explanation
SynChart: Synthesizing Charts from Language Models is a system that can create charts and visualizations based on text descriptions. Instead of manually designing charts, users can simply provide a written explanation of what they want to visualize, and SynChart will generate the corresponding chart.
This is useful for people who want to create visualizations but don't have the design skills or time to do it themselves. By using advanced language models, SynChart can understand the meaning and intent behind the text and translate that into an appropriate chart.
The researchers also created a new dataset called the SynChart Dataset to train and evaluate SynChart. This dataset contains thousands of chart-text pairs, allowing the system to learn how to associate natural language with visual representations.
Technical Explanation
The design rationales behind SynChart include enabling more accessible data visualization, improving the productivity of chart creation, and leveraging the capabilities of large language models.
SynChart's architecture uses a two-stage process. First, a language model encodes the input text into a semantic representation. Then, a chart generation model uses this representation to select the appropriate chart type and generate the visual elements.
The SynChart Dataset was collected from a variety of sources, including academic papers, news articles, and web pages. It contains over 20,000 chart-text pairs, covering a range of chart types and topic domains.
Critical Analysis
The paper acknowledges several limitations of SynChart, such as its dependence on the quality and coverage of the training data, and the potential for biases or errors to be introduced by the language model.
It also notes that SynChart is currently focused on generating static charts and may not be able to handle more complex, interactive visualizations. Further research could explore extending the system to support a wider range of chart types and interactivity.
Additionally, the paper suggests that evaluating the effectiveness of SynChart-generated charts for specific tasks, such as data analysis or storytelling, would be an important area for future work.
Conclusion
Overall, SynChart represents an exciting step in making data visualization more accessible and efficient. By leveraging the capabilities of large language models, the system can generate high-quality charts from natural language inputs, potentially enabling a wider range of users to create meaningful visualizations.
As the field of language-driven data visualization continues to evolve, further research on techniques like SynChart could have significant implications for how people interact with and understand data in the future.
This summary was produced with help from an AI and may contain inaccuracies - check out the links to read the original source documents!
Related Papers
0
SynChart: Synthesizing Charts from Language Models
Mengchen Liu, Qixiu Li, Dongdong Chen, Dong Chen, Jianmin Bao, Yunsheng Li
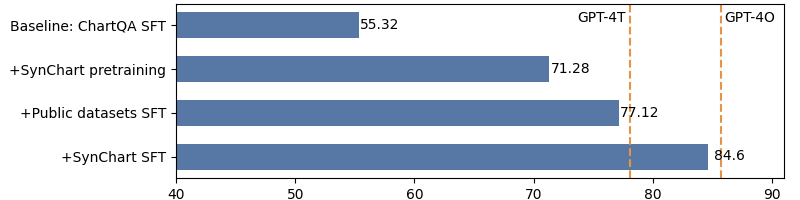
With the release of GPT-4V(O), its use in generating pseudo labels for multi-modality tasks has gained significant popularity. However, it is still a secret how to build such advanced models from its base large language models (LLMs). This work explores the potential of using LLMs alone for data generation and develop competitive multi-modality models focusing on chart understanding. We construct a large-scale chart dataset, SynChart, which contains approximately 4 million diverse chart images with over 75 million dense annotations, including data tables, code, descriptions, and question-answer sets. We trained a 4.2B chart-expert model using this dataset and achieve near-GPT-4O performance on the ChartQA task, surpassing GPT-4V.
Read more9/26/2024
🔗
0
Evaluating Task-based Effectiveness of MLLMs on Charts
Yifan Wu, Lutao Yan, Leixian Shen, Yunhai Wang, Nan Tang, Yuyu Luo
Chart question answering (ChartQA) tasks play a critical role in interpreting and extracting insights from visualization charts. While recent advancements in multimodal large language models (MLLMs) like GPT-4o have shown promise in high-level ChartQA tasks, such as chart captioning, their effectiveness in low-level ChartQA tasks (e.g., identifying correlations) remains underexplored. In this paper, we address this gap by evaluating MLLMs on low-level ChartQA using a newly curated dataset, ChartInsights, which consists of 22,347 (chart, task, query, answer) covering 10 data analysis tasks across 7 chart types. We systematically evaluate 19 advanced MLLMs, including 12 open-source and 7 closed-source models. The average accuracy rate across these models is 39.8%, with GPT-4o achieving the highest accuracy at 69.17%. To further explore the limitations of MLLMs in low-level ChartQA, we conduct experiments that alter visual elements of charts (e.g., changing color schemes, adding image noise) to assess their impact on the task effectiveness. Furthermore, we propose a new textual prompt strategy, Chain-of-Charts, tailored for low-level ChartQA tasks, which boosts performance by 14.41%, achieving an accuracy of 83.58%. Finally, incorporating a visual prompt strategy that directs attention to relevant visual elements further improves accuracy to 84.32%.
Read more10/3/2024

0
ChartX & ChartVLM: A Versatile Benchmark and Foundation Model for Complicated Chart Reasoning
Renqiu Xia, Bo Zhang, Hancheng Ye, Xiangchao Yan, Qi Liu, Hongbin Zhou, Zijun Chen, Min Dou, Botian Shi, Junchi Yan, Yu Qiao
Recently, many versatile Multi-modal Large Language Models (MLLMs) have emerged continuously. However, their capacity to query information depicted in visual charts and engage in reasoning based on the queried contents remains under-explored. In this paper, to comprehensively and rigorously benchmark the ability of the off-the-shelf MLLMs in the chart domain, we construct ChartX, a multi-modal evaluation set covering 18 chart types, 7 chart tasks, 22 disciplinary topics, and high-quality chart data. Besides, we develop ChartVLM to offer a new perspective on handling multi-modal tasks that strongly depend on interpretable patterns, such as reasoning tasks in the field of charts or geometric images. We evaluate the chart-related ability of mainstream MLLMs and our ChartVLM on the proposed ChartX evaluation set. Extensive experiments demonstrate that ChartVLM surpasses both versatile and chart-related large models, achieving results comparable to GPT-4V. We believe that our study can pave the way for further exploration in creating a more comprehensive chart evaluation set and developing more interpretable multi-modal models. Both ChartX and ChartVLM are available at: https://github.com/UniModal4Reasoning/ChartVLM
Read more9/12/2024

0
Advancing Multimodal Large Language Models in Chart Question Answering with Visualization-Referenced Instruction Tuning
Xingchen Zeng, Haichuan Lin, Yilin Ye, Wei Zeng
Emerging multimodal large language models (MLLMs) exhibit great potential for chart question answering (CQA). Recent efforts primarily focus on scaling up training datasets (i.e., charts, data tables, and question-answer (QA) pairs) through data collection and synthesis. However, our empirical study on existing MLLMs and CQA datasets reveals notable gaps. First, current data collection and synthesis focus on data volume and lack consideration of fine-grained visual encodings and QA tasks, resulting in unbalanced data distribution divergent from practical CQA scenarios. Second, existing work follows the training recipe of the base MLLMs initially designed for natural images, under-exploring the adaptation to unique chart characteristics, such as rich text elements. To fill the gap, we propose a visualization-referenced instruction tuning approach to guide the training dataset enhancement and model development. Specifically, we propose a novel data engine to effectively filter diverse and high-quality data from existing datasets and subsequently refine and augment the data using LLM-based generation techniques to better align with practical QA tasks and visual encodings. Then, to facilitate the adaptation to chart characteristics, we utilize the enriched data to train an MLLM by unfreezing the vision encoder and incorporating a mixture-of-resolution adaptation strategy for enhanced fine-grained recognition. Experimental results validate the effectiveness of our approach. Even with fewer training examples, our model consistently outperforms state-of-the-art CQA models on established benchmarks. We also contribute a dataset split as a benchmark for future research. Source codes and datasets of this paper are available at https://github.com/zengxingchen/ChartQA-MLLM.
Read more8/13/2024