TinyChart: Efficient Chart Understanding with Visual Token Merging and Program-of-Thoughts Learning

0
Sign in to get full access
Overview
- This paper introduces TinyChart, an efficient approach for understanding and analyzing chart images.
- TinyChart leverages visual token merging and a novel program-of-thoughts learning technique to achieve high accuracy on chart understanding tasks.
- The authors demonstrate that TinyChart outperforms existing state-of-the-art methods on various chart-related benchmarks, while being significantly more efficient in terms of model size and inference time.
Plain English Explanation
TinyChart is a new system designed to help computers better understand and interpret chart images, such as those found in data visualizations, reports, and presentations. The key innovation of TinyChart is its use of "visual token merging" and "program-of-thoughts learning".
Visual token merging allows TinyChart to efficiently encode the important visual elements of a chart, like the axes, legends, and data points, into a compact representation. This helps the system process chart information more quickly and with less computational resources compared to previous approaches.
The program-of-thoughts learning technique enables TinyChart to reason about charts in a more sophisticated way. Rather than just identifying the individual chart elements, TinyChart can use this learning approach to piece together a higher-level understanding of the chart's overall meaning and purpose. This allows it to perform better on tasks like answering questions about the data shown in the chart.
The researchers demonstrate that TinyChart outperforms other state-of-the-art methods for understanding charts, while also being much more efficient in terms of the model size and the time required to process a chart. This makes TinyChart an attractive option for real-world applications that need to quickly and accurately interpret chart-based information.
Technical Explanation
The core technical innovations in TinyChart are the visual token merging and program-of-thoughts learning approaches. [The visual token merging technique is similar to the approaches described in <a href="https://aimodels.fyi/papers/arxiv/mmc-advancing-multimodal-chart-understanding-large-scale">MMC</a> and <a href="https://aimodels.fyi/papers/arxiv/onechart-purify-chart-structural-extraction-via-one">OneChart</a>, which aim to efficiently encode the salient visual elements of a chart.] The program-of-thoughts learning builds on the contextual chain-of-thought ideas explored in <a href="https://aimodels.fyi/papers/arxiv/chartthinker-contextual-chain-thought-approach-to-optimized">ChartThinker</a>.
Specifically, TinyChart first extracts visual tokens corresponding to chart components like axes, legends, and data points. It then merges these tokens in a learnable way to produce a compact representation of the chart's visual structure. This merged representation is then used as input to a transformer-based model that has been trained using the program-of-thoughts learning approach.
The program-of-thoughts learning trains the model to not just identify chart elements, but to reason about the higher-level semantics and relationships between them. This allows TinyChart to perform well on a variety of chart understanding tasks, such as answering questions about the data or summarizing the key insights.
The experiments in the paper demonstrate that TinyChart outperforms previous state-of-the-art methods like <a href="https://aimodels.fyi/papers/arxiv/mchartqa-universal-benchmark-multimodal-chart-question-answer">MCHartQA</a> and <a href="https://aimodels.fyi/papers/arxiv/tinygpt-v-efficient-multimodal-large-language-model">TinyGPT-V</a> on benchmarks like chart question answering and chart captioning. Importantly, TinyChart achieves this superior performance while using a significantly smaller model size and faster inference time.
Critical Analysis
The authors thoroughly evaluate TinyChart on a range of chart understanding tasks and demonstrate its superior performance compared to prior work. However, the paper does not provide a detailed analysis of the limitations or failure cases of the system.
For example, it would be helpful to understand how TinyChart performs on more complex or unconventional chart types, or how it handles noisy or low-quality chart inputs. The authors also do not discuss the potential biases or blindspots that may be present in the training data or model.
Additionally, while the program-of-thoughts learning approach is an interesting innovation, the paper does not provide a deep dive into how this technique works in practice or the specific reasoning capabilities it endows the model with. More insights into the internal workings of this learning strategy would allow readers to better assess its merits and potential drawbacks.
Overall, the paper presents a compelling new method for efficient chart understanding, but could be strengthened by a more thorough exploration of the system's limitations and failure modes, as well as a deeper technical explanation of the key innovations.
Conclusion
TinyChart is a promising new approach for enabling computers to efficiently and accurately understand and analyze chart-based information. By leveraging visual token merging and program-of-thoughts learning, TinyChart outperforms prior state-of-the-art methods on a variety of chart understanding tasks, while using significantly less computational resources.
The innovations in TinyChart could have important implications for a wide range of real-world applications that rely on interpreting and extracting insights from data visualizations, such as business intelligence, scientific research, and education. As the amount of chart-based information continues to grow, efficient and capable systems like TinyChart will become increasingly valuable for helping humans make sense of complex data.
This summary was produced with help from an AI and may contain inaccuracies - check out the links to read the original source documents!
Related Papers
0
TinyChart: Efficient Chart Understanding with Visual Token Merging and Program-of-Thoughts Learning
Liang Zhang, Anwen Hu, Haiyang Xu, Ming Yan, Yichen Xu, Qin Jin, Ji Zhang, Fei Huang
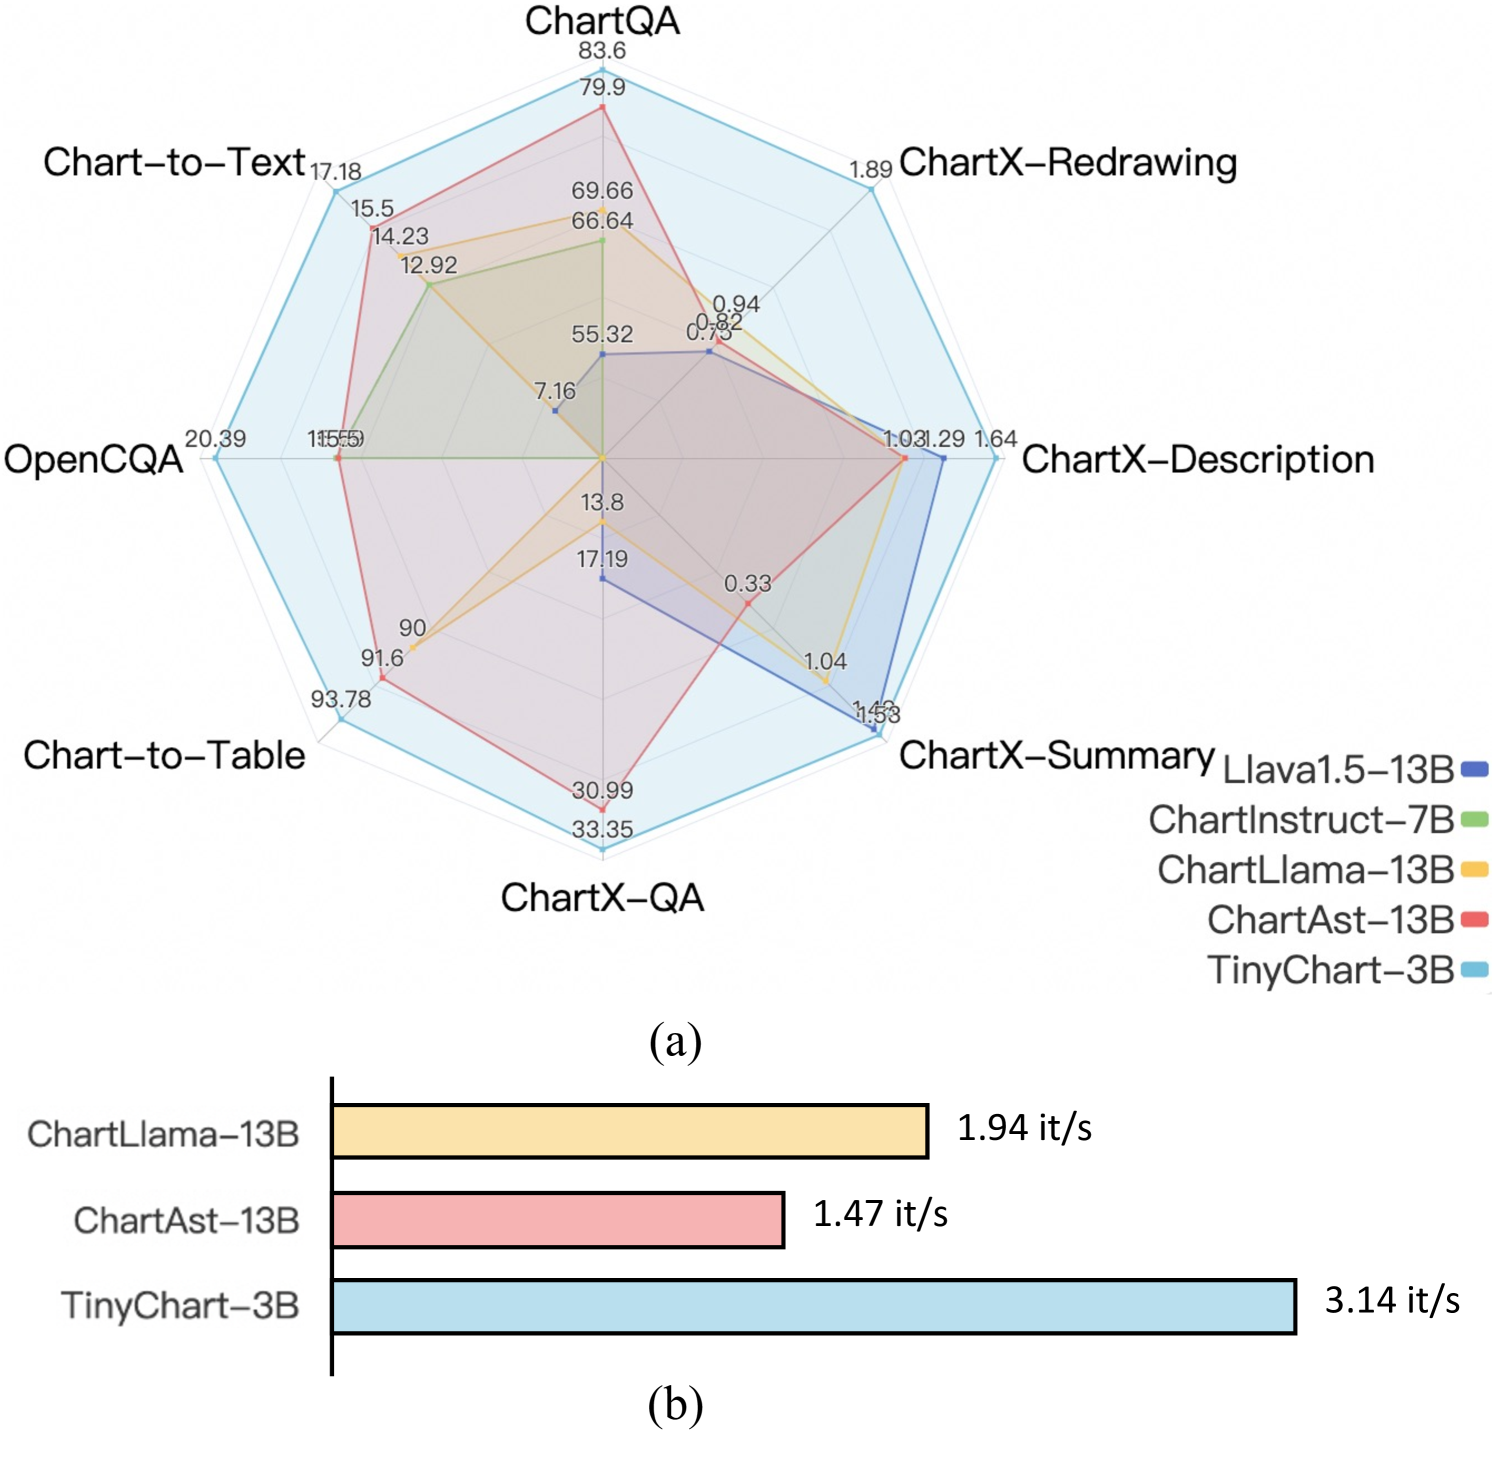
Charts are important for presenting and explaining complex data relationships. Recently, multimodal large language models (MLLMs) have shown remarkable capabilities in various chart understanding tasks. However, the sheer size of these models in terms of parameters and computational requirements limits their use in resource-constrained environments. In this paper, we present TinyChart, an efficient MLLM for chart understanding with only 3B parameters. TinyChart overcomes two key challenges in efficient chart understanding: (1) reduce the burden of learning numerical computations through a Program-of-Thoughts (PoT) learning strategy, which trains the model to generate Python programs for numerical calculations, and (2) reduce lengthy vision feature sequences produced by the vision transformer for high-resolution images through a Vision Token Merging module, which gradually merges most similar vision tokens. Extensive experiments demonstrate that our 3B TinyChart achieves SOTA performance on a variety of chart understanding benchmarks including ChartQA, Chart-to-Text, Chart-to-Table, OpenCQA, and ChartX. It outperforms several chart understanding MLLM with up to 13B parameters such as ChartLlama and ChartAst, and close-sourced general-purpose MLLM GPT-4V on ChartQA. It also demonstrates its superior efficiency with higher throughput during inference due to a smaller model scale and more efficient vision encoding. Our code and model are available at https://github.com/X-PLUG/mPLUG-DocOwl/tree/main/TinyChart.
Read more4/26/2024

0
ChartX & ChartVLM: A Versatile Benchmark and Foundation Model for Complicated Chart Reasoning
Renqiu Xia, Bo Zhang, Hancheng Ye, Xiangchao Yan, Qi Liu, Hongbin Zhou, Zijun Chen, Min Dou, Botian Shi, Junchi Yan, Yu Qiao
Recently, many versatile Multi-modal Large Language Models (MLLMs) have emerged continuously. However, their capacity to query information depicted in visual charts and engage in reasoning based on the queried contents remains under-explored. In this paper, to comprehensively and rigorously benchmark the ability of the off-the-shelf MLLMs in the chart domain, we construct ChartX, a multi-modal evaluation set covering 18 chart types, 7 chart tasks, 22 disciplinary topics, and high-quality chart data. Besides, we develop ChartVLM to offer a new perspective on handling multi-modal tasks that strongly depend on interpretable patterns, such as reasoning tasks in the field of charts or geometric images. We evaluate the chart-related ability of mainstream MLLMs and our ChartVLM on the proposed ChartX evaluation set. Extensive experiments demonstrate that ChartVLM surpasses both versatile and chart-related large models, achieving results comparable to GPT-4V. We believe that our study can pave the way for further exploration in creating a more comprehensive chart evaluation set and developing more interpretable multi-modal models. Both ChartX and ChartVLM are available at: https://github.com/UniModal4Reasoning/ChartVLM
Read more9/12/2024
🤯
0
ChartBench: A Benchmark for Complex Visual Reasoning in Charts
Zhengzhuo Xu, Sinan Du, Yiyan Qi, Chengjin Xu, Chun Yuan, Jian Guo
Multimodal Large Language Models (MLLMs) have shown impressive capabilities in image understanding and generation. However, current benchmarks fail to accurately evaluate the chart comprehension of MLLMs due to limited chart types and inappropriate metrics. To address this, we propose ChartBench, a comprehensive benchmark designed to assess chart comprehension and data reliability through complex visual reasoning. ChartBench includes 42 categories, 66.6k charts, and 600k question-answer pairs. Notably, many charts lack data point annotations, which requires MLLMs to derive values similar to human understanding by leveraging inherent chart elements such as color, legends, and coordinate systems. We also design an enhanced evaluation metric, Acc+, to evaluate MLLMs without extensive manual or costly LLM-based evaluations. Furthermore, we propose two baselines based on the chain of thought and supervised fine-tuning to improve model performance on unannotated charts. Extensive experimental evaluations of 18 open-sourced and 3 proprietary MLLMs reveal their limitations in chart comprehension and offer valuable insights for further research. Code and dataset are publicly available at https://chartbench.github.io.
Read more6/21/2024
💬
0
On Pre-training of Multimodal Language Models Customized for Chart Understanding
Wan-Cyuan Fan, Yen-Chun Chen, Mengchen Liu, Lu Yuan, Leonid Sigal
Recent studies customizing Multimodal Large Language Models (MLLMs) for domain-specific tasks have yielded promising results, especially in the field of scientific chart comprehension. These studies generally utilize visual instruction tuning with specialized datasets to enhance question and answer (QA) accuracy within the chart domain. However, they often neglect the fundamental discrepancy between natural image-caption pre-training data and digital chart image-QA data, particularly in the models' capacity to extract underlying numeric values from charts. This paper tackles this oversight by exploring the training processes necessary to improve MLLMs' comprehension of charts. We present three key findings: (1) Incorporating raw data values in alignment pre-training markedly improves comprehension of chart data. (2) Replacing images with their textual representation randomly during end-to-end fine-tuning transfer the language reasoning capability to chart interpretation skills. (3) Requiring the model to first extract the underlying chart data and then answer the question in the fine-tuning can further improve the accuracy. Consequently, we introduce CHOPINLLM, an MLLM tailored for in-depth chart comprehension. CHOPINLLM effectively interprets various types of charts, including unannotated ones, while maintaining robust reasoning abilities. Furthermore, we establish a new benchmark to evaluate MLLMs' understanding of different chart types across various comprehension levels. Experimental results show that CHOPINLLM exhibits strong performance in understanding both annotated and unannotated charts across a wide range of types.
Read more8/2/2024