Automated Question Generation on Tabular Data for Conversational Data Exploration

0
🛸
Sign in to get full access
Overview
- Exploratory data analysis (EDA) is an important step for understanding a dataset and deriving insights.
- While various EDA techniques using visualizations have been explored, they can be challenging for non-technical users to interpret.
- Conversational data exploration is gaining popularity as a way for non-experts to explore datasets without deep technical knowledge.
- This paper proposes a system that recommends interesting natural language questions based on relevant slices of a dataset in a conversational setting.
Plain English Explanation
Exploring and understanding a dataset is a crucial step before performing any analyses or drawing conclusions. Exploratory data analysis (EDA) techniques often rely on creating visualizations, such as plots and charts, to help identify patterns and uncover insights. However, these visualizations can be difficult for non-technical users to interpret correctly.
To make data exploration more accessible, the researchers in this paper developed a conversational system that can recommend interesting questions about a dataset. The system identifies interesting slices or subsets of the data, and then generates natural language questions that a user can ask to explore those insights further. This allows people without deep technical expertise to investigate the dataset and discover meaningful information.
The key innovations in this work are:
- Automatically identifying interesting subsets of the data based on various measures of "interestingness."
- Generating natural language questions that are tailored to those interesting data slices.
- Presenting the questions to the user in a conversational interface, enabling an interactive exploration of the dataset.
By making data exploration more accessible through natural language questions, this system can help non-technical users gain valuable insights from their data without needing to become data analysis experts themselves.
Technical Explanation
The researchers propose a system that generates natural language questions to guide users in exploring interesting slices of a dataset. First, the system identifies a set of "interesting" columns and column combinations in the dataset based on various interestingness measures. These measures consider factors like the statistical properties of the data, the relationships between different columns, and the uniqueness or rarity of certain values or patterns.
Next, the system uses a fine-tuned variation of the pre-trained T5 language model to generate natural language questions that are tailored to the identified interesting data slices. The questions are generated in a specific format, with placeholders for inserting relevant values from the dataset.
Finally, the system ranks the generated questions based on their relevance and interestingness, and presents the top-ranked questions to the user in a conversational interface. This allows the user to explore the dataset by asking and answering these natural language questions, without needing to have advanced data analysis skills.
The researchers evaluate their system using a collection of real-world datasets and demonstrate its ability to surface meaningful insights that can be easily interpreted by non-technical users. This work contributes to the growing field of natural language interfaces for tabular data querying and visualization, as well as the development of automated prompt generation systems for tabular data tasks and conversational interfaces for data exploration.
Critical Analysis
The proposed system offers a promising approach to making data exploration more accessible for non-technical users. By automatically identifying interesting data slices and generating natural language questions, the system can help users uncover insights without requiring advanced data analysis skills.
However, the researchers acknowledge that the system's performance is dependent on the quality of the interestingness measures used to identify the relevant data slices. More sophisticated measures or a combination of multiple approaches may be needed to ensure the system consistently surfaces the most meaningful insights.
Additionally, the researchers note that the generated questions may not always be perfectly tailored to the user's specific needs or interests. Incorporating user feedback or personalization mechanisms could help the system better understand the user's goals and preferences, leading to more relevant and useful question recommendations.
Finally, the researchers did not extensively explore the scalability of their approach, particularly when dealing with very large or complex datasets. Investigating ways to maintain the system's effectiveness and efficiency as the data size and dimensionality increase would be an important area for future research.
Conclusion
This paper presents a novel approach to making data exploration more accessible for non-technical users through a conversational system that recommends interesting natural language questions based on relevant data slices. By automating the identification of interesting insights and generating tailored questions, the system enables users to explore datasets and uncover valuable information without the need for advanced data analysis skills.
While the proposed system shows promise, there are opportunities to further refine the interestingness measures, personalize the question recommendations, and address scalability challenges. Continued research in this area has the potential to democratize data exploration and empower a wider range of users to derive meaningful insights from their datasets.
This summary was produced with help from an AI and may contain inaccuracies - check out the links to read the original source documents!
Related Papers
🛸
0
Automated Question Generation on Tabular Data for Conversational Data Exploration
Ritwik Chaudhuri, Rajmohan C, Kirushikesh DB, Arvind Agarwal
Exploratory data analysis (EDA) is an essential step for analyzing a dataset to derive insights. Several EDA techniques have been explored in the literature. Many of them leverage visualizations through various plots. But it is not easy to interpret them for a non-technical user, and producing appropriate visualizations is also tough when there are a large number of columns. Few other works provide a view of some interesting slices of data but it is still difficult for the user to draw relevant insights from them. Of late, conversational data exploration is gaining a lot of traction among non-technical users. It helps the user to explore the dataset without having deep technical knowledge about the data. Towards this, we propose a system that recommends interesting questions in natural language based on relevant slices of a dataset in a conversational setting. Specifically, given a dataset, we pick a select set of interesting columns and identify interesting slices of such columns and column combinations based on few interestingness measures. We use our own fine-tuned variation of a pre-trained language model(T5) to generate natural language questions in a specific manner. We then slot-fill values in the generated questions and rank them for recommendations. We show the utility of our proposed system in a coversational setting with a collection of real datasets.
Read more7/19/2024
🛸
0
Automatic Generation of Conversational Interfaces for Tabular Data Analysis
Marcos Gomez-Vazquez, Jordi Cabot, Robert Claris'o
Tabular data is the most common format to publish and exchange structured data online. A clear example is the growing number of open data portals published by public administrations. However, exploitation of these data sources is currently limited to technical people able to programmatically manipulate and digest such data. As an alternative, we propose the use of chatbots to offer a conversational interface to facilitate the exploration of tabular data sources, including support for data analytics questions that are responded via charts rendered by the chatbot. Moreover, our chatbots are automatically generated from the data source itself thanks to the instantiation of a configurable collection of conversation patterns matched to the chatbot intents and entities.
Read more8/7/2024
0
Automated Data Visualization from Natural Language via Large Language Models: An Exploratory Study
Yang Wu, Yao Wan, Hongyu Zhang, Yulei Sui, Wucai Wei, Wei Zhao, Guandong Xu, Hai Jin
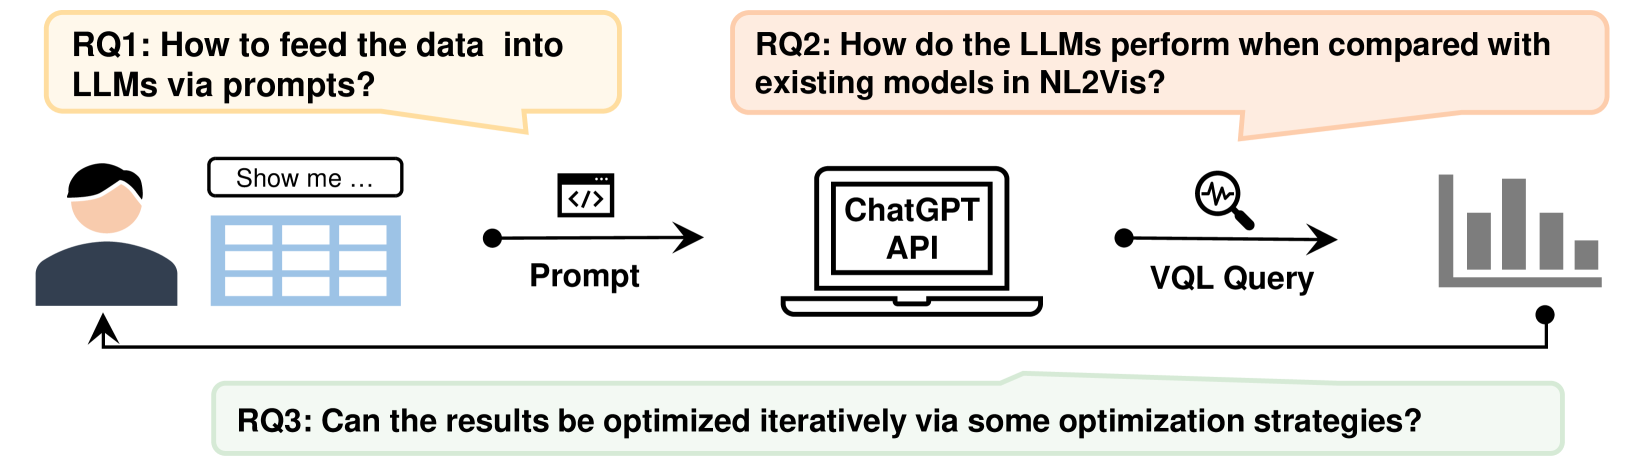
The Natural Language to Visualization (NL2Vis) task aims to transform natural-language descriptions into visual representations for a grounded table, enabling users to gain insights from vast amounts of data. Recently, many deep learning-based approaches have been developed for NL2Vis. Despite the considerable efforts made by these approaches, challenges persist in visualizing data sourced from unseen databases or spanning multiple tables. Taking inspiration from the remarkable generation capabilities of Large Language Models (LLMs), this paper conducts an empirical study to evaluate their potential in generating visualizations, and explore the effectiveness of in-context learning prompts for enhancing this task. In particular, we first explore the ways of transforming structured tabular data into sequential text prompts, as to feed them into LLMs and analyze which table content contributes most to the NL2Vis. Our findings suggest that transforming structured tabular data into programs is effective, and it is essential to consider the table schema when formulating prompts. Furthermore, we evaluate two types of LLMs: finetuned models (e.g., T5-Small) and inference-only models (e.g., GPT-3.5), against state-of-the-art methods, using the NL2Vis benchmarks (i.e., nvBench). The experimental results reveal that LLMs outperform baselines, with inference-only models consistently exhibiting performance improvements, at times even surpassing fine-tuned models when provided with certain few-shot demonstrations through in-context learning. Finally, we analyze when the LLMs fail in NL2Vis, and propose to iteratively update the results using strategies such as chain-of-thought, role-playing, and code-interpreter. The experimental results confirm the efficacy of iterative updates and hold great potential for future study.
Read more4/29/2024

0
New!Charting EDA: Characterizing Interactive Visualization Use in Computational Notebooks with a Mixed-Methods Formalism
Dylan Wootton, Amy Rae Fox, Evan Peck, Arvind Satyanarayan
Interactive visualizations are powerful tools for Exploratory Data Analysis (EDA), but how do they affect the observations analysts make about their data? We conducted a qualitative experiment with 13 professional data scientists analyzing two datasets with Jupyter notebooks, collecting a rich dataset of interaction traces and think-aloud utterances. By qualitatively coding participant utterances, we introduce a formalism that describes EDA as a sequence of analysis states, where each state is comprised of either a representation an analyst constructs (e.g., the output of a data frame, an interactive visualization, etc.) or an observation the analyst makes (e.g., about missing data, the relationship between variables, etc.). By applying our formalism to our dataset, we identify that interactive visualizations, on average, lead to earlier and more complex insights about relationships between dataset attributes compared to static visualizations. Moreover, by calculating metrics such as revisit count and representational diversity, we uncover that some representations serve more as planning aids during EDA rather than tools strictly for hypothesis-answering. We show how these measures help identify other patterns of analysis behavior, such as the 80-20 rule, where a small subset of representations drove the majority of observations. Based on these findings, we offer design guidelines for interactive exploratory analysis tooling and reflect on future directions for studying the role that visualizations play in EDA.
Read more9/17/2024