Charting EDA: Characterizing Interactive Visualization Use in Computational Notebooks with a Mixed-Methods Formalism

0

Sign in to get full access
Overview
- Charting EDA is a study that characterizes how users interact with interactive visualizations in computational notebooks.
- The researchers used a mixed-methods approach, combining quantitative analysis of user interactions and qualitative interviews.
- The goal was to better understand how visual exploration and analysis happen in computational notebooks.
Plain English Explanation
The paper examines how people use interactive data visualizations within computational notebooks, which are software tools that allow users to write code, see results, and document their work all in one place.
The researchers took a two-pronged approach to studying this. First, they quantitatively analyzed the interactions users had with the visualizations, tracking things like how often they zoomed, panned, or hovered over different elements. This gave them insights into the common patterns of visual exploration.
Secondly, the researchers conducted interviews with users to get a deeper, qualitative understanding of how they used the interactive visualizations as part of their broader data analysis workflow. This helped uncover the motivations, strategies, and pain points around working with visualizations in computational notebooks.
By combining these quantitative and qualitative methods, the researchers were able to build a comprehensive picture of how interactive visualizations are actually used in practice, rather than just making assumptions. This can help developers of computational notebooks better design the tools and features to support more effective visual data exploration.
Technical Explanation
The researchers used a mixed-methods approach to characterize how users interact with interactive visualizations in computational notebooks. They first conducted a quantitative analysis of user interactions, tracking metrics like zooming, panning, and hovering. This allowed them to identify common patterns of visual exploration behavior.
To complement this, the researchers also carried out qualitative interviews with users. This provided deeper insights into the motivations, strategies, and pain points around working with visualizations as part of the broader data analysis workflow in computational notebooks.
By combining these quantitative and qualitative methods, the researchers were able to build a comprehensive understanding of how interactive visualizations are actually used in practice. This can inform the design of computational notebooks to better support effective visual data exploration.
Critical Analysis
The researchers acknowledge some limitations of their study, such as the relatively small sample size for the interviews and the focus on a single computational notebook platform. They suggest that further research is needed to see how the findings might generalize to other contexts.
Additionally, while the study provides valuable insights into current practices, it does not delve into deeper questions around the cognitive processes and analytical strategies underlying the observed visualization usage patterns. Exploring these areas in more depth could yield additional insights to inform the design of more effective visual data exploration tools.
Conclusion
This study offers a nuanced, empirically-grounded understanding of how users interact with interactive visualizations within computational notebooks. By combining quantitative and qualitative methods, the researchers were able to uncover common patterns of visual exploration as well as the motivations and pain points behind these practices.
The findings can inform the design of computational notebooks and other data analysis tools to better support effective visual data exploration. This is an important step towards creating more usable and productive computational environments for a wide range of users.
This summary was produced with help from an AI and may contain inaccuracies - check out the links to read the original source documents!
Related Papers
0
Charting EDA: Characterizing Interactive Visualization Use in Computational Notebooks with a Mixed-Methods Formalism
Dylan Wootton, Amy Rae Fox, Evan Peck, Arvind Satyanarayan
Interactive visualizations are powerful tools for Exploratory Data Analysis (EDA), but how do they affect the observations analysts make about their data? We conducted a qualitative experiment with 13 professional data scientists analyzing two datasets with Jupyter notebooks, collecting a rich dataset of interaction traces and think-aloud utterances. By qualitatively coding participant utterances, we introduce a formalism that describes EDA as a sequence of analysis states, where each state is comprised of either a representation an analyst constructs (e.g., the output of a data frame, an interactive visualization, etc.) or an observation the analyst makes (e.g., about missing data, the relationship between variables, etc.). By applying our formalism to our dataset, we identify that interactive visualizations, on average, lead to earlier and more complex insights about relationships between dataset attributes compared to static visualizations. Moreover, by calculating metrics such as revisit count and representational diversity, we uncover that some representations serve more as planning aids during EDA rather than tools strictly for hypothesis-answering. We show how these measures help identify other patterns of analysis behavior, such as the 80-20 rule, where a small subset of representations drove the majority of observations. Based on these findings, we offer design guidelines for interactive exploratory analysis tooling and reflect on future directions for studying the role that visualizations play in EDA.
Read more9/17/2024
🛸
0
Automated Question Generation on Tabular Data for Conversational Data Exploration
Ritwik Chaudhuri, Rajmohan C, Kirushikesh DB, Arvind Agarwal
Exploratory data analysis (EDA) is an essential step for analyzing a dataset to derive insights. Several EDA techniques have been explored in the literature. Many of them leverage visualizations through various plots. But it is not easy to interpret them for a non-technical user, and producing appropriate visualizations is also tough when there are a large number of columns. Few other works provide a view of some interesting slices of data but it is still difficult for the user to draw relevant insights from them. Of late, conversational data exploration is gaining a lot of traction among non-technical users. It helps the user to explore the dataset without having deep technical knowledge about the data. Towards this, we propose a system that recommends interesting questions in natural language based on relevant slices of a dataset in a conversational setting. Specifically, given a dataset, we pick a select set of interesting columns and identify interesting slices of such columns and column combinations based on few interestingness measures. We use our own fine-tuned variation of a pre-trained language model(T5) to generate natural language questions in a specific manner. We then slot-fill values in the generated questions and rank them for recommendations. We show the utility of our proposed system in a coversational setting with a collection of real datasets.
Read more7/19/2024

0
Facilitating Mixed-Methods Analysis with Computational Notebooks
Jiawen Stefanie Zhu, Zibo Zhang, Jian Zhao
Data exploration is an important aspect of the workflow of mixed-methods researchers, who conduct both qualitative and quantitative analysis. However, there currently exists few tools that adequately support both types of analysis simultaneously, forcing researchers to context-switch between different tools and increasing their mental burden when integrating the results. To address this gap, we propose a unified environment that facilitates mixed-methods analysis in a computational notebook-based settings. We conduct a scenario study with three HCI mixed-methods researchers to gather feedback on our design concept and to understand our users' needs and requirements.
Read more5/31/2024
0
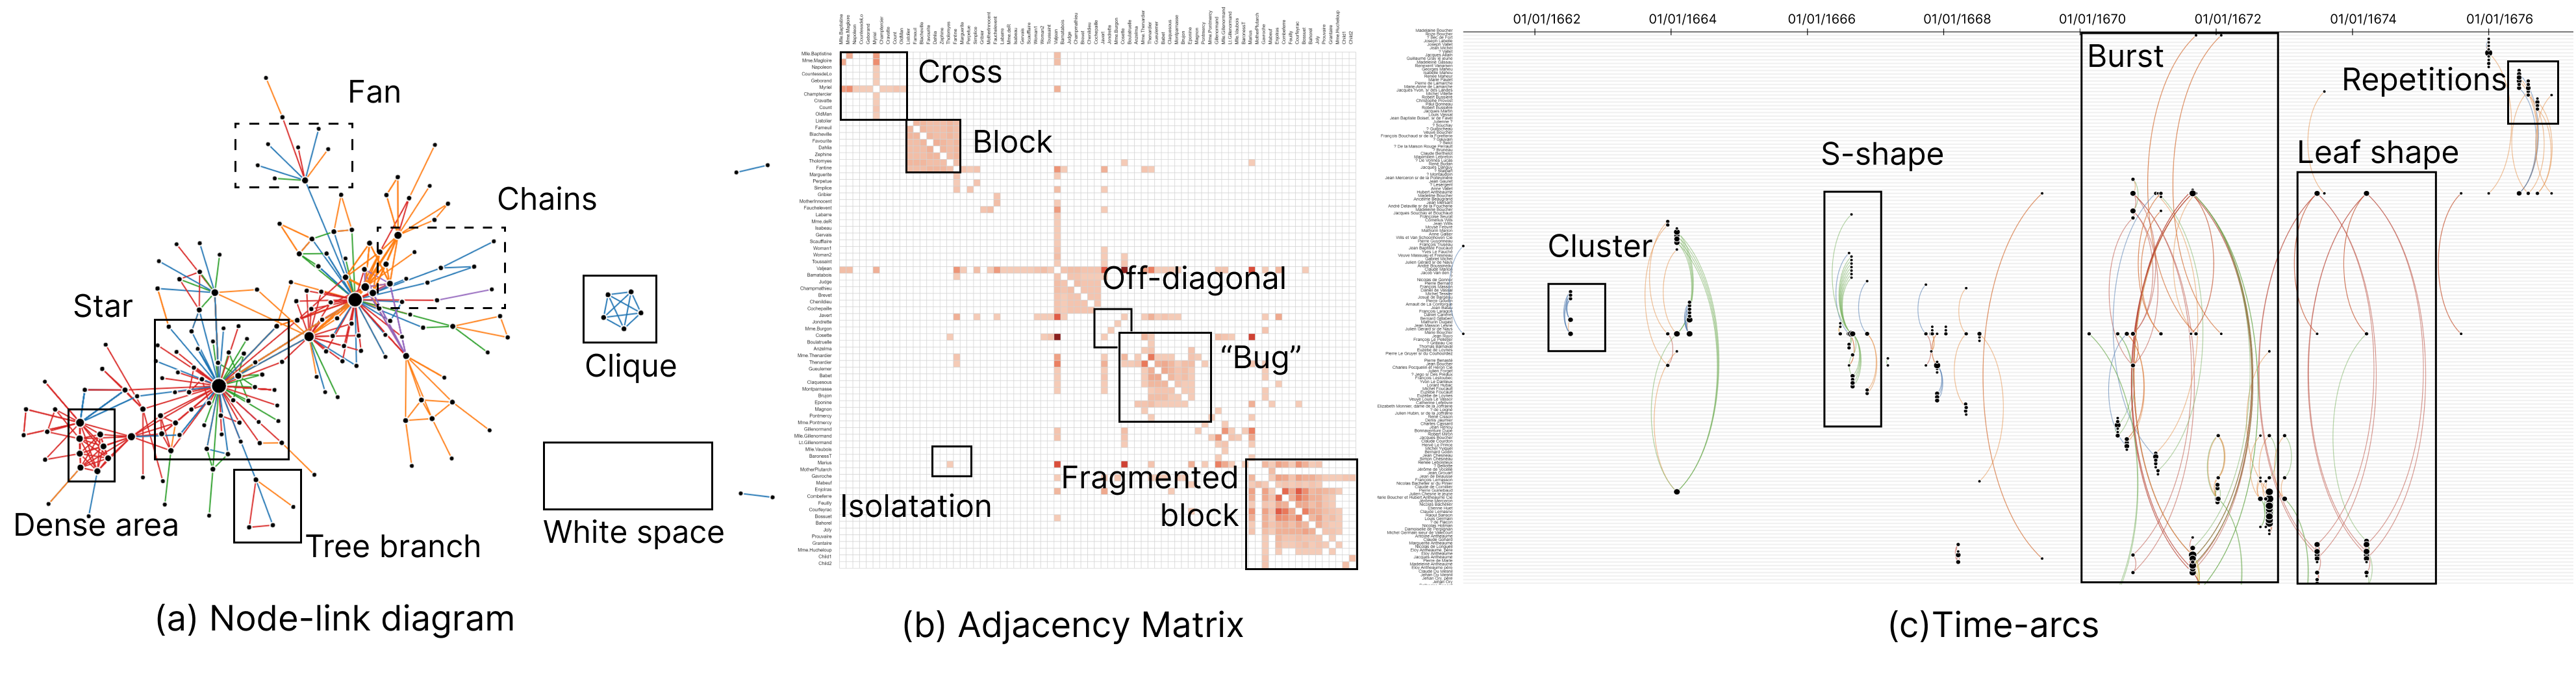
Does This Have a Particular Meaning? Interactive Pattern Explanation for Network Visualizations
Xinhuan Shu, Alexis Pister, Junxiu Tang, Fanny Chevalier, Benjamin Bach
This paper presents an interactive technique to explain visual patterns in network visualizations to analysts who do not understand these visualizations and who are learning to read them. Learning a visualization requires mastering its visual grammar and decoding information presented through visual marks, graphical encodings, and spatial configurations. To help people learn network visualization designs and extract meaningful information, we introduce the concept of interactive pattern explanation that allows viewers to select an arbitrary area in a visualization, then automatically mines the underlying data patterns, and explains both visual and data patterns present in the viewer's selection. In a qualitative and a quantitative user study with a total of 32 participants, we compare interactive pattern explanations to textual-only and visual-only (cheatsheets) explanations. Our results show that interactive explanations increase learning of i) unfamiliar visualizations, ii) patterns in network science, and iii) the respective network terminology.
Read more8/6/2024