ClustML: A Measure of Cluster Pattern Complexity in Scatterplots Learnt from Human-labeled Groupings

0
🚀
Sign in to get full access
Overview
- Researchers propose a new visual quality measure (VQM) called ClustML to automatically assess the perceptual complexity of grouping patterns in scatterplots.
- ClustML encodes scatterplots using a Gaussian Mixture Model and classifies the grouping patterns based on previously collected human judgments.
- The model improves upon existing VQMs by better estimating human judgments on two-Gaussian cluster patterns and providing higher accuracy when ranking general cluster patterns.
- The researchers use ClustML to analyze kinship data for genome-wide association studies, where experts rely on visual analysis of large sets of scatterplots.
- The benchmark datasets and new VQM are made available for practical use and further improvements.
Plain English Explanation
Visualizations like scatterplots are often used by analysts to explore and understand complex data. However, interpreting the visual grouping patterns in these plots can be challenging. ClustML: An Automatic Visual Quality Measure for Scatterplots proposes a new tool to help with this task.
The researchers trained ClustML on previous human judgments of scatterplot patterns. This allowed the model to learn how people perceive the "complexity" of different grouping patterns. Now, ClustML can look at a new scatterplot and automatically estimate how visually complex the grouping patterns are, just like a human expert would.
This is useful for analysts who work with large datasets that generate many scatterplots, like in genome-wide association studies. Instead of manually reviewing each plot, they can use ClustML to quickly identify the most interesting or complex patterns that deserve closer inspection. The researchers showed that ClustML outperforms existing tools at this task.
By making ClustML publicly available, the researchers hope it will become a practical tool to support data analysis and visualization. It could also inspire further research into modeling human perception of visual patterns.
Technical Explanation
ClustML: An Automatic Visual Quality Measure for Scatterplots proposes a new visual quality measure (VQM) to automatically assess the perceptual complexity of grouping patterns in scatterplots.
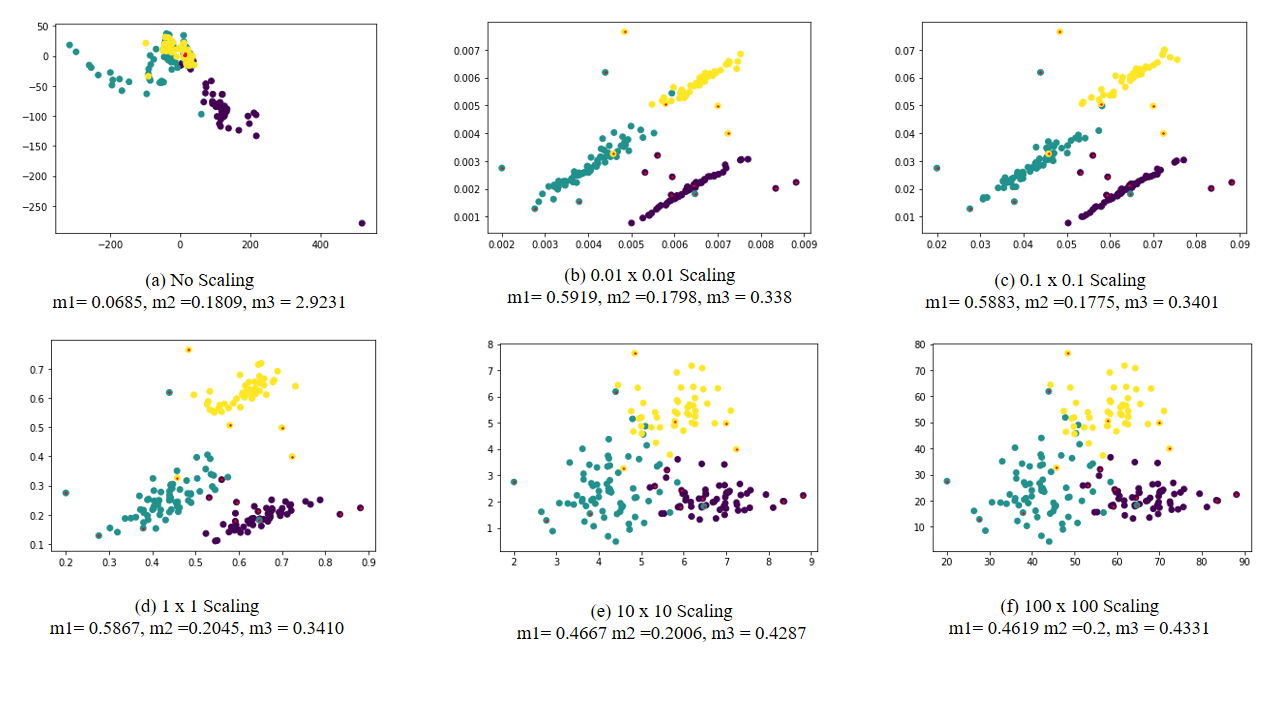
The model encodes scatterplots in the parametric space of a Gaussian Mixture Model (GMM), which captures the underlying cluster structure. It then uses a classifier trained on previously collected human judgments to estimate the perceived complexity of the grouping patterns.
Specifically, the number of initial mixture components and the final number of combined groups are used as features to train the complexity classifier. This approach improves upon existing VQMs in two key ways:
- It better estimates human judgments on scatterplots with two-Gaussian cluster patterns, which prior models struggled with.
- It provides higher accuracy when ranking the general cluster patterns present in scatterplots.
The researchers demonstrate the utility of ClustML by applying it to analyze kinship data for genome-wide association studies. In this domain, experts rely heavily on visual analysis of large sets of scatterplots, making an automated VQM like ClustML a valuable tool.
The benchmark datasets and the new ClustML VQM are made publicly available to support practical use and further research into modeling human perception of visual patterns. This builds on prior work on interpreting visual clusters in dimensionality reduction, enhancing dimension-reduced scatter plots, and clustering distinguishability criteria.
Critical Analysis
The paper presents a compelling approach to automatically assessing the perceptual complexity of scatterplot grouping patterns. The use of human judgment data to train the complexity classifier is a key strength, as it allows the model to better align with how people actually perceive these visual patterns.
However, the authors acknowledge that the current version of ClustML has some limitations. For example, it may struggle with scatterplots that have irregular or overlapping cluster shapes, beyond the Gaussian patterns it was trained on. Approaches that consider multi-view clustering or characterize the imprecision of cluster boundaries could potentially address these issues in future work.
Additionally, while the researchers demonstrate the utility of ClustML for genome-wide association studies, its broader applicability to other visualization domains remains to be explored. Further validation and testing on a wider range of scatterplot use cases would help strengthen the generalizability of the approach.
Overall, ClustML represents an important step forward in developing automated tools to support human interpretation of complex visual patterns. As the authors note, continued research in this area has the potential to significantly enhance data analysis and visualization capabilities across many fields.
Conclusion
ClustML: An Automatic Visual Quality Measure for Scatterplots introduces a new visual quality measure that can automatically assess the perceptual complexity of grouping patterns in scatterplots.
By encoding scatterplots using a Gaussian Mixture Model and training a classifier on human judgment data, ClustML provides a way to quantify the visual "complexity" of cluster structures. This tool can help analysts more efficiently explore and understand large collections of scatterplots, as demonstrated in the genome-wide association study use case.
The availability of the benchmark datasets and the ClustML model itself opens up opportunities for further research and practical applications in data visualization and analysis. As the field continues to explore how to better model and interpret human perception of visual patterns, tools like ClustML could become invaluable for supporting experts in various domains.
This summary was produced with help from an AI and may contain inaccuracies - check out the links to read the original source documents!
Related Papers
🚀
0
ClustML: A Measure of Cluster Pattern Complexity in Scatterplots Learnt from Human-labeled Groupings
Mostafa M. Abbas, Ehsan Ullah, Abdelkader Baggag, Halima Bensmail, Michael Sedlmair, Michael Aupetit
Visual quality measures (VQMs) are designed to support analysts by automatically detecting and quantifying patterns in visualizations. We propose a new VQM for visual grouping patterns in scatterplots, called ClustML, which is trained on previously collected human subject judgments. Our model encodes scatterplots in the parametric space of a Gaussian Mixture Model and uses a classifier trained on human judgment data to estimate the perceptual complexity of grouping patterns. The numbers of initial mixture components and final combined groups. It improves on existing VQMs, first, by better estimating human judgments on two-Gaussian cluster patterns and, second, by giving higher accuracy when ranking general cluster patterns in scatterplots. We use it to analyze kinship data for genome-wide association studies, in which experts rely on the visual analysis of large sets of scatterplots. We make the benchmark datasets and the new VQM available for practical use and further improvements.
Read more5/2/2024
🤿
0
ScatterUQ: Interactive Uncertainty Visualizations for Multiclass Deep Learning Problems
Harry Li, Steven Jorgensen, John Holodnak, Allan Wollaber
Recently, uncertainty-aware deep learning methods for multiclass labeling problems have been developed that provide calibrated class prediction probabilities and out-of-distribution (OOD) indicators, letting machine learning (ML) consumers and engineers gauge a model's confidence in its predictions. However, this extra neural network prediction information is challenging to scalably convey visually for arbitrary data sources under multiple uncertainty contexts. To address these challenges, we present ScatterUQ, an interactive system that provides targeted visualizations to allow users to better understand model performance in context-driven uncertainty settings. ScatterUQ leverages recent advances in distance-aware neural networks, together with dimensionality reduction techniques, to construct robust, 2-D scatter plots explaining why a model predicts a test example to be (1) in-distribution and of a particular class, (2) in-distribution but unsure of the class, and (3) out-of-distribution. ML consumers and engineers can visually compare the salient features of test samples with training examples through the use of a ``hover callback'' to understand model uncertainty performance and decide follow up courses of action. We demonstrate the effectiveness of ScatterUQ to explain model uncertainty for a multiclass image classification on a distance-aware neural network trained on Fashion-MNIST and tested on Fashion-MNIST (in distribution) and MNIST digits (out of distribution), as well as a deep learning model for a cyber dataset. We quantitatively evaluate dimensionality reduction techniques to optimize our contextually driven UQ visualizations. Our results indicate that the ScatterUQ system should scale to arbitrary, multiclass datasets. Our code is available at https://github.com/mit-ll-responsible-ai/equine-webapp
Read more5/10/2024
0
A new visual quality metric for Evaluating the performance of multidimensional projections
Maniru Ibrahim, Thales Vieira
Multidimensional projections (MP) are among the most essential approaches in the visual analysis of multidimensional data. It transforms multidimensional data into two-dimensional representations that may be shown as scatter plots while preserving their similarity with the original data. Human visual perception is frequently used to evaluate the quality of MP. In this work, we propose to study and improve on a well-known map called Local Affine Multidimensional Projection (LAMP), which takes a multidimensional instance and embeds it in Cartesian space via moving least squares deformation. We propose a new visual quality metric based on human perception. The new metric combines three previously used metrics: silhouette coefficient, neighborhood preservation, and silhouette ratio. We show that the proposed metric produces more precise results in analyzing the quality of MP than other previously used metrics. Finally, we describe an algorithm that attempts to overcome a limitation of the LAMP method which requires a similar scale for control points and their counterparts in the Cartesian space.
Read more7/24/2024
📈
0
A new model for natural groupings in high-dimensional data
Mireille Boutin, Evzenie Coupkova
Clustering aims to divide a set of points into groups. The current paradigm assumes that the grouping is well-defined (unique) given the probability model from which the data is drawn. Yet, recent experiments have uncovered several high-dimensional datasets that form different binary groupings after projecting the data to randomly chosen one-dimensional subspaces. This paper describes a probability model for the data that could explain this phenomenon. It is a simple model to serve as a proof of concept for understanding the geometry of high-dimensional data. We start by building a rescaled multivariate Bernouilli model (stretched hypercube) so to create several overlapping grouping structures in the data. The size of each scaling parameter is related to the likelihood of uncovering the corresponding grouping by random 1D projection. Clusters in the original space are then created by adding noise to this cluster-free model. In high dimension, these clusters would hardly be observable given a sample set from the distribution because of the curse of dimensionality, but the binary groupings are clear. Our construction makes it clear that one needs to make a distinction between groupings and clusters in the original space. It also highlights the need to interpret any clustering found in projected data as merely one among potentially many other groupings in a dataset.
Read more6/26/2024