Data Formulator 2: Iteratively Creating Rich Visualizations with AI

0

Sign in to get full access
Overview
- This paper introduces Data Formulator 2, an AI-powered system that helps users iteratively create and refine rich data visualizations.
- The system guides users through an interactive process of selecting data, choosing visualization types, and customizing the visualization.
- The paper showcases how Data Formulator 2 can be used to explore trends in renewable energy data.
Plain English Explanation
Data Formulator 2: Iteratively Creating Rich Visualizations with AI presents a new AI-powered tool that makes it easier for people to create and improve data visualizations. The system walks users through the process of selecting the data they want to visualize, picking the right type of chart or graph, and then customizing the visual elements.
The paper demonstrates how this tool can be used to explore trends in renewable energy data. For example, users can load data on solar, wind, and other renewable power sources, and then experiment with different visualization styles to uncover insights about how these energy sources are growing over time. The AI provides guidance and suggestions to help users refine the visualizations and discover meaningful patterns in the data.
Overall, the goal of Data Formulator 2 is to empower more people to create effective data visualizations, even if they don't have advanced data analysis or design skills. By making the visualization creation process more interactive and iterative, the system aims to help users quickly generate compelling visual representations of complex data.
Technical Explanation
Data Formulator 2: Iteratively Creating Rich Visualizations with AI introduces a new system that combines human and AI capabilities to assist users in creating rich data visualizations. The key components of the system include:
- A natural language interface that allows users to describe their data and visualization goals
- An AI-powered engine that translates the natural language inputs into appropriate visualization types and customizations
- An iterative workflow that enables users to refine the visualizations through cycles of feedback and adjustment
The paper demonstrates the system's capabilities through a case study focused on exploring trends in renewable energy data. Users can load relevant datasets, experiment with different chart types and encoding options, and receive guidance from the AI to optimize the visualizations.
The iterative approach allows users to gradually refine the visuals, testing out various configurations to uncover meaningful insights in the data. The AI provides suggestions and critiques to help steer the visualization development process, drawing on its understanding of effective visual design principles.
Overall, the core innovation of Data Formulator 2 is its ability to blend human creativity and domain expertise with AI-powered visualization generation and optimization. This integration aims to empower a broader range of users to create insightful data visualizations, even without advanced technical skills.
Critical Analysis
The Data Formulator 2 paper presents a promising approach for democratizing data visualization, but also raises some potential concerns and areas for further research.
One key limitation discussed is the system's reliance on predefined visualization types and customization options. While the AI-powered guidance aims to steer users towards effective visual designs, there may be cases where more open-ended or custom visualizations are needed to fully capture the nuances of the data.
Additionally, the paper does not provide much detail on the specific AI algorithms and models powering the system. Further research could explore the technical underpinnings in more depth, as well as evaluate the system's performance and accuracy compared to alternative visualization tools.
Another area for further exploration is the user experience and cognitive load associated with the iterative refinement process. While the interactive workflow is designed to be intuitive, longer sessions may still prove taxing for some users. Studying how people engage with and learn from the system over time could yield insights to improve the overall experience.
Overall, the Data Formulator 2 research demonstrates an innovative approach to blending human and AI capabilities for data visualization. With further development and testing, the system could become a powerful tool for empowering more people to create impactful visual representations of complex data.
Conclusion
Data Formulator 2: Iteratively Creating Rich Visualizations with AI introduces a novel system that aims to make it easier for people to create and refine effective data visualizations. By combining natural language interfaces, AI-powered guidance, and an iterative workflow, the system helps bridge the gap between data and insight, enabling a broader range of users to uncover meaningful patterns and trends.
The paper showcases the system's capabilities through a case study focused on renewable energy data, demonstrating how users can load relevant datasets, experiment with different visualization styles, and receive AI-driven suggestions to optimize the visuals. This interactive approach represents an important step towards democratizing data visualization and empowering more people to tell compelling data-driven stories.
While the research highlights the potential of this technology, it also identifies areas for further development, such as expanding the system's flexibility and exploring the cognitive load associated with the iterative process. Addressing these challenges could help unlock the full transformative potential of AI-assisted data visualization tools like Data Formulator 2.
Overall, this research represents an exciting advance in the field of human-AI collaboration, illustrating how the integration of complementary strengths can lead to more accessible and impactful data exploration experiences.
This summary was produced with help from an AI and may contain inaccuracies - check out the links to read the original source documents!
Related Papers
0
Data Formulator 2: Iteratively Creating Rich Visualizations with AI
Chenglong Wang, Bongshin Lee, Steven Drucker, Dan Marshall, Jianfeng Gao
To create rich visualizations, data analysts often need to iterate back and forth among data processing and chart specification to achieve their goals. To achieve this, analysts need not only proficiency in data transformation and visualization tools but also efforts to manage the branching history consisting of many different versions of data and charts. Recent LLM-powered AI systems have greatly improved visualization authoring experiences, for example by mitigating manual data transformation barriers via LLMs' code generation ability. However, these systems do not work well for iterative visualization authoring, because they often require analysts to provide, in a single turn, a text-only prompt that fully describes the complex visualization task to be performed, which is unrealistic to both users and models in many cases. In this paper, we present Data Formulator 2, an LLM-powered visualization system to address these challenges. With Data Formulator 2, users describe their visualization intent with blended UI and natural language inputs, and data transformation are delegated to AI. To support iteration, Data Formulator 2 lets users navigate their iteration history and reuse previous designs towards new ones so that they don't need to start from scratch every time. In a user study with eight participants, we observed that Data Formulator 2 allows participants to develop their own iteration strategies to complete challenging data exploration sessions.
Read more8/30/2024

0
HAIChart: Human and AI Paired Visualization System
Yupeng Xie, Yuyu Luo, Guoliang Li, Nan Tang
The growing importance of data visualization in business intelligence and data science emphasizes the need for tools that can efficiently generate meaningful visualizations from large datasets. Existing tools fall into two main categories: human-powered tools (e.g., Tableau and PowerBI), which require intensive expert involvement, and AI-powered automated tools (e.g., Draco and Table2Charts), which often fall short of guessing specific user needs. In this paper, we aim to achieve the best of both worlds. Our key idea is to initially auto-generate a set of high-quality visualizations to minimize manual effort, then refine this process iteratively with user feedback to more closely align with their needs. To this end, we present HAIChart, a reinforcement learning-based framework designed to iteratively recommend good visualizations for a given dataset by incorporating user feedback. Specifically, we propose a Monte Carlo Graph Search-based visualization generation algorithm paired with a composite reward function to efficiently explore the visualization space and automatically generate good visualizations. We devise a visualization hints mechanism to actively incorporate user feedback, thus progressively refining the visualization generation module. We further prove that the top-k visualization hints selection problem is NP-hard and design an efficient algorithm. We conduct both quantitative evaluations and user studies, showing that HAIChart significantly outperforms state-of-the-art human-powered tools (21% better at Recall and 1.8 times faster) and AI-powered automatic tools (25.1% and 14.9% better in terms of Hit@3 and R10@30, respectively).
Read more9/10/2024
0
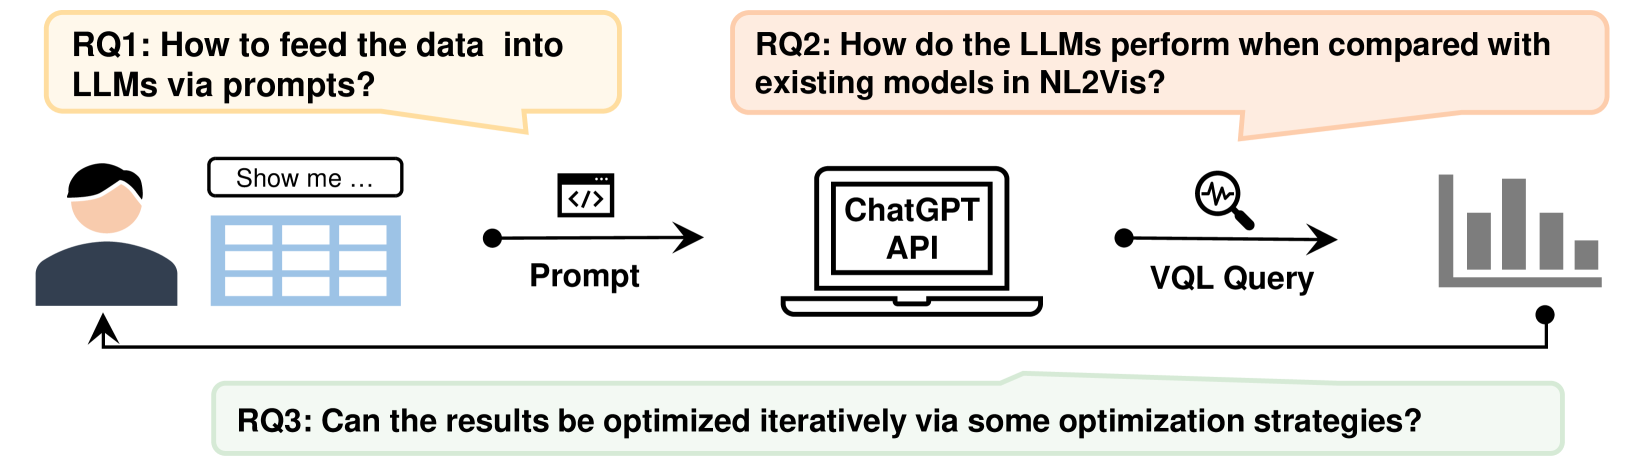
Automated Data Visualization from Natural Language via Large Language Models: An Exploratory Study
Yang Wu, Yao Wan, Hongyu Zhang, Yulei Sui, Wucai Wei, Wei Zhao, Guandong Xu, Hai Jin
The Natural Language to Visualization (NL2Vis) task aims to transform natural-language descriptions into visual representations for a grounded table, enabling users to gain insights from vast amounts of data. Recently, many deep learning-based approaches have been developed for NL2Vis. Despite the considerable efforts made by these approaches, challenges persist in visualizing data sourced from unseen databases or spanning multiple tables. Taking inspiration from the remarkable generation capabilities of Large Language Models (LLMs), this paper conducts an empirical study to evaluate their potential in generating visualizations, and explore the effectiveness of in-context learning prompts for enhancing this task. In particular, we first explore the ways of transforming structured tabular data into sequential text prompts, as to feed them into LLMs and analyze which table content contributes most to the NL2Vis. Our findings suggest that transforming structured tabular data into programs is effective, and it is essential to consider the table schema when formulating prompts. Furthermore, we evaluate two types of LLMs: finetuned models (e.g., T5-Small) and inference-only models (e.g., GPT-3.5), against state-of-the-art methods, using the NL2Vis benchmarks (i.e., nvBench). The experimental results reveal that LLMs outperform baselines, with inference-only models consistently exhibiting performance improvements, at times even surpassing fine-tuned models when provided with certain few-shot demonstrations through in-context learning. Finally, we analyze when the LLMs fail in NL2Vis, and propose to iteratively update the results using strategies such as chain-of-thought, role-playing, and code-interpreter. The experimental results confirm the efficacy of iterative updates and hold great potential for future study.
Read more4/29/2024
📊
0
Formative Study for AI-assisted Data Visualization
Rania Saber, Anna Fariha
This formative study investigates the impact of data quality on AI-assisted data visualizations, focusing on how uncleaned datasets influence the outcomes of these tools. By generating visualizations from datasets with inherent quality issues, the research aims to identify and categorize the specific visualization problems that arise. The study further explores potential methods and tools to address these visualization challenges efficiently and effectively. Although tool development has not yet been undertaken, the findings emphasize enhancing AI visualization tools to handle flawed data better. This research underscores the critical need for more robust, user-friendly solutions that facilitate quicker and easier correction of data and visualization errors, thereby improving the overall reliability and usability of AI-assisted data visualization processes.
Read more9/12/2024