Design-Specific Transformations in Visualization

0
Sign in to get full access
Overview
- This paper discusses design-specific transforms in data visualization, focusing on how researchers can leverage transformations to address specific design challenges.
- It proposes a transformation-centric model that shifts the emphasis from static visualization designs to the transformations applied to the data.
- The paper explores how different types of transformations can be used to tackle a range of visualization design problems, drawing on examples from prior research.
Plain English Explanation
Data visualizations are powerful tools for making sense of complex information. However, designing effective visualizations can be challenging, as researchers must consider factors like the data characteristics, the task at hand, and the intended audience.
This paper suggests a new approach that shifts the focus from the final visualization design to the transformations applied to the data. By thinking in terms of transformations rather than static designs, researchers can more easily address specific design challenges.
For example, What We Augment When We Augment Visualizations explored how transformations like semantic zooming and brushing could be used to enhance visualizations for exploratory data analysis. Similarly, A Typology of Decision-Making Tasks in Visualization looked at how transformations like aggregation and filtering could support different types of decision-making tasks.
The key idea is that by understanding the design goals and the transformations needed to achieve them, researchers can more systematically develop effective visualizations. This approach can be applied to a wide range of visualization challenges, from co-designing unstructured text data visualization systems to identifying the challenges in designing, developing, and evaluating data visualizations.
Technical Explanation
The paper proposes a transformation-centric model for visualization design, which shifts the emphasis from static visualization designs to the transformations applied to the data. The model consists of three key elements:
- Transformation Space: This refers to the set of possible transformations that can be applied to the data, such as filtering, aggregation, semantic zooming, and brushing.
- Design Goals: These are the specific objectives the visualization is trying to achieve, such as supporting exploration, comparison, or decision-making.
- Transformation Mapping: This is the process of selecting and applying the appropriate transformations to the data to meet the design goals.
The paper explores how this model can be used to address a range of visualization design challenges, drawing on examples from prior research. For instance, Visual Transformation Telling demonstrated how different transformations could be used to tell effective data stories, while Identifying Challenges in Designing, Developing, and Evaluating Data Visualizations highlighted the importance of considering transformations in the design process.
Critical Analysis
The transformation-centric model proposed in this paper offers a fresh perspective on visualization design, shifting the focus from static designs to the transformations applied to the data. This approach has several potential benefits:
- It provides a more systematic way to address specific design challenges by focusing on the transformations needed to achieve the desired outcomes.
- It allows for more flexibility and experimentation, as researchers can explore a wider range of transformations to find the most effective solutions.
- It encourages a deeper understanding of the relationship between data, task, and design, which can lead to more informed and impactful visualizations.
However, the paper does not address some potential limitations of this approach. For example, the complexity of the transformation space may increase as the volume and variety of data grows, making it challenging to navigate. Additionally, the effectiveness of the transformations may depend on the specific context and user needs, which may not be fully captured in the transformation-centric model.
Further research is needed to explore the practical implementation of this approach, as well as to address potential scalability and generalizability issues. Nonetheless, the transformation-centric model presented in this paper offers a promising direction for advancing the field of data visualization.
Conclusion
This paper introduces a transformation-centric model for data visualization design, which shifts the emphasis from static visualization designs to the transformations applied to the data. By focusing on the transformations needed to achieve specific design goals, this approach provides a more systematic way to address a range of visualization challenges.
The insights and examples presented in this paper demonstrate the potential of this transformation-centric approach to enhance the design, development, and evaluation of data visualizations. As the field of data visualization continues to evolve, this model could serve as a valuable framework for researchers and practitioners to explore new and innovative ways of making sense of complex information.
This summary was produced with help from an AI and may contain inaccuracies - check out the links to read the original source documents!
Related Papers
0
Design-Specific Transformations in Visualization
Eugene Wu, Remco Chang
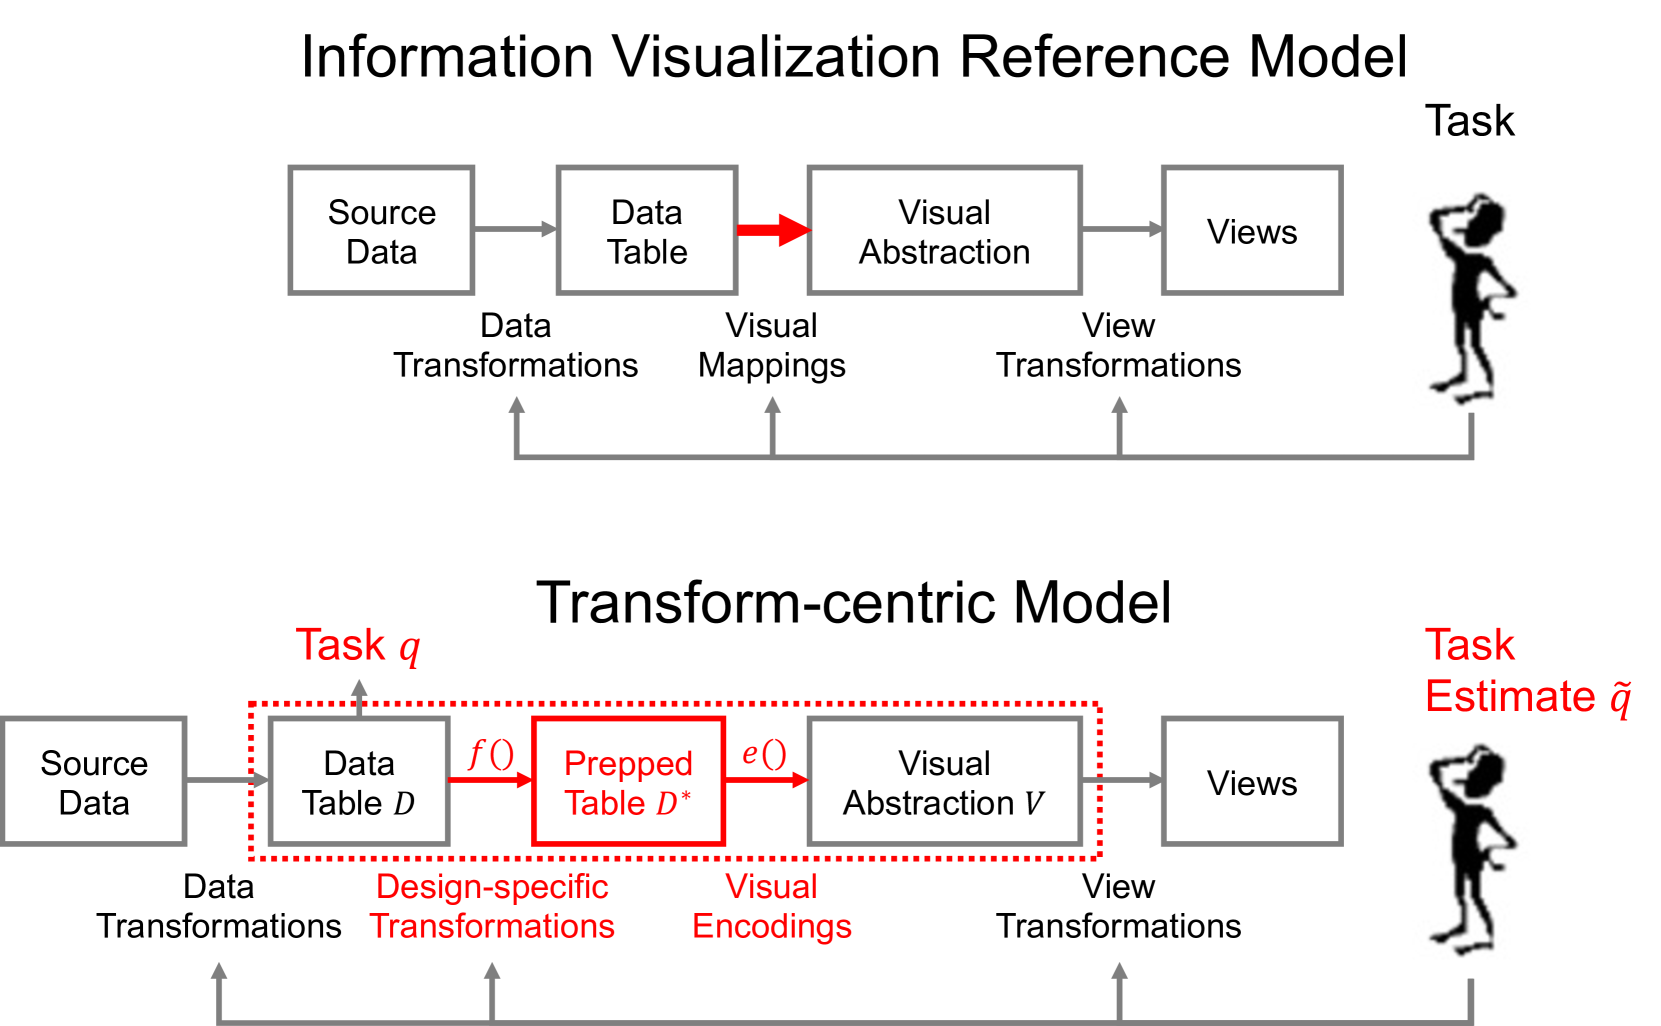
In visualization, the process of transforming raw data into visually comprehensible representations is pivotal. While existing models like the Information Visualization Reference Model describe the data-to-visual mapping process, they often overlook a crucial intermediary step: design-specific transformations. This process, occurring after data transformation but before visual-data mapping, further derives data, such as groupings, layout, and statistics, that are essential to properly render the visualization. In this paper, we advocate for a deeper exploration of design-specific transformations, highlighting their importance in understanding visualization properties, particularly in relation to user tasks. We incorporate design-specific transformations into the Information Visualization Reference Model and propose a new formalism that encompasses the user task as a function over data. The resulting formalism offers three key benefits over existing visualization models: (1) describing task as compositions of functions, (2) enabling analysis of data transformations for visual-data mapping, and (3) empowering reasoning about visualization correctness and effectiveness. We further discuss the potential implications of this model on visualization theory and visualization experiment design.
Read more8/12/2024

0
What We Augment When We Augment Visualizations: A Design Elicitation Study of How We Visually Express Data Relationships
Grace Guo, John Stasko, Alex Endert
Visual augmentations are commonly added to charts and graphs in order to convey richer and more nuanced information about relationships in the data. However, many design spaces proposed for categorizing augmentations were defined in a top-down manner, based on expert heuristics or from surveys of published visualizations. Less well understood are user preferences and intuitions when designing augmentations. In this paper, we address the gap by conducting a design elicitation study, where study participants were asked to draw the different ways they would visually express the meaning of ten different prompts. We obtained 364 drawings from the study, and identified the emergent categories of augmentations used by participants. The contributions of this paper are: (i) a user-defined design space of visualization augmentations, (ii) a repository of hand drawn augmentations made by study participants, and (iii) a discussion of insights into participant considerations, and connections between our study and existing design guidelines.
Read more4/22/2024

0
Intents, Techniques, and Components: a Unified Analysis of Interaction Authoring Tasks in Data Visualization
Hyemi Song, Sai Gopinath, Zhicheng Liu
There is a growing interest in designing tools to support interactivity specification and authoring in data visualization. To develop expressive and flexible tools, we need theories and models that describe the task space of interaction authoring. Although multiple taxonomies and frameworks exist for interactive visualization, they primarily focus on how visualizations are used, not how interactivity is composed. To fill this gap, we conduct an analysis of 592 interaction units from 47 real-world visualization applications. Based on the analysis, we present a unified analysis of interaction authoring tasks across three levels of description: intents, representative techniques, and low-level implementation components. We examine our framework's descriptive, evaluative, and generative powers for critiquing existing interactivity authoring tools and informing new tool development.
Read more9/4/2024

0
A Typology of Decision-Making Tasks for Visualization
Camelia D. Brumar, Sam Molnar, Gabriel Appleby, Kristi Potter, Remco Chang
Despite decision-making being a vital goal of data visualization, little work has been done to differentiate the decision-making tasks within our field. While visualization task taxonomies and typologies exist, they are often too granular for describing complex decision goals and decision-making processes, thus limiting their potential use in designing decision-support tools. In this paper, we contribute a typology of decision-making tasks that were iteratively refined from a list of design goals distilled from a literature review. Our typology is concise and consists of only three tasks: choose, activate, and create. Originally proposed by the scientific community, we extend and provide definitions for these tasks that are suitable for the visualization community. Our proposed typology offers two benefits. First, it facilitates the composition of decisions using these three tasks, allowing for flexible and clear descriptions across varying complexities and domains. Second, diagrams created using this typology encourage productive discourse between visualization designers and domain experts by abstracting the intricacies of data, thereby promoting clarity and rigorous analysis of decision-making processes. We motivate the use of our typology through four case studies and demonstrate the benefits of our approach through semi-structured interviews conducted with experienced members of the visualization community, comprising academic and industry experts, who have contributed to developing or publishing decision support systems for domain experts. Our interviewees composed diagrams using our typology to delineate the decision-making processes that drive their decision-support tools, demonstrating its descriptive capacity and effectiveness.
Read more4/23/2024