A Typology of Decision-Making Tasks for Visualization

0

Sign in to get full access
Overview
- Proposes a typology of decision-making tasks for visualization
- Identifies six key decision-making tasks: Identification, Comparison, Ranking, Selection, Planning, and Monitoring
- Provides a framework to help designers and researchers understand the different types of decision-making supported by visualizations
Plain English Explanation
This paper presents a framework for categorizing the different types of decision-making tasks that visualizations can support. The researchers identified six key decision-making tasks: Identification, Comparison, Ranking, Selection, Planning, and Monitoring.
For example, a visualization might help you identify a specific data point, compare two or more options, rank a set of items, select the best option, plan a course of action, or monitor the progress of a task. By understanding these different decision-making tasks, designers and researchers can create more effective visualizations that better support the specific needs of users.
Technical Explanation
The paper proposes a typology of decision-making tasks for visualization, which is a framework for categorizing the different types of decision-making that visualizations can support. The researchers identified six key decision-making tasks:
- Identification: Locating, detecting, or recognizing a specific data point or feature within a visualization.
- Comparison: Assessing the similarities and differences between two or more data points or entities.
- Ranking: Ordering a set of data points or entities based on some criterion or criteria.
- Selection: Choosing the best or most appropriate data point or entity from a set of options.
- Planning: Using a visualization to map out a sequence of actions or steps to achieve a desired goal.
- Monitoring: Tracking the progress, status, or changes of a data set or process over time.
The paper provides detailed definitions and examples for each of these decision-making tasks, as well as a discussion of the cognitive processes and visualization techniques associated with them. The authors argue that this typology can help designers and researchers better understand the different ways that visualizations can support decision-making, and can inform the design and evaluation of visualization tools.
Critical Analysis
The proposed typology provides a useful framework for thinking about the different decision-making tasks that visualizations can support. However, the paper acknowledges that there may be some overlap or blurring between the categories, and that the specific tasks and cognitive processes involved may vary depending on the context and the user's goals and expertise.
Additionally, the paper does not extensively discuss the potential challenges or limitations of using visualizations for decision-making, such as the risk of biases, the need for appropriate data literacy, or the potential for visualizations to oversimplify or distort complex information. Further research may be needed to explore these issues in more depth.
Overall, the typology presented in this paper is a valuable contribution to the field of visualization, as it provides a starting point for designers and researchers to better understand the various decision-making tasks that visualizations can support. By considering these different tasks, developers can create more targeted and effective visualization tools to support users in a variety of decision-making contexts.
Conclusion
This paper proposes a typology of six key decision-making tasks that visualizations can support: Identification, Comparison, Ranking, Selection, Planning, and Monitoring. This framework can help designers and researchers better understand the different ways that visualizations can be used to support decision-making, and can inform the development of more effective visualization tools. While the typology provides a useful starting point, further research may be needed to explore the potential challenges and limitations of using visualizations for decision-making.
This summary was produced with help from an AI and may contain inaccuracies - check out the links to read the original source documents!
Related Papers
0
A Typology of Decision-Making Tasks for Visualization
Camelia D. Brumar, Sam Molnar, Gabriel Appleby, Kristi Potter, Remco Chang
Despite decision-making being a vital goal of data visualization, little work has been done to differentiate the decision-making tasks within our field. While visualization task taxonomies and typologies exist, they are often too granular for describing complex decision goals and decision-making processes, thus limiting their potential use in designing decision-support tools. In this paper, we contribute a typology of decision-making tasks that were iteratively refined from a list of design goals distilled from a literature review. Our typology is concise and consists of only three tasks: choose, activate, and create. Originally proposed by the scientific community, we extend and provide definitions for these tasks that are suitable for the visualization community. Our proposed typology offers two benefits. First, it facilitates the composition of decisions using these three tasks, allowing for flexible and clear descriptions across varying complexities and domains. Second, diagrams created using this typology encourage productive discourse between visualization designers and domain experts by abstracting the intricacies of data, thereby promoting clarity and rigorous analysis of decision-making processes. We motivate the use of our typology through four case studies and demonstrate the benefits of our approach through semi-structured interviews conducted with experienced members of the visualization community, comprising academic and industry experts, who have contributed to developing or publishing decision support systems for domain experts. Our interviewees composed diagrams using our typology to delineate the decision-making processes that drive their decision-support tools, demonstrating its descriptive capacity and effectiveness.
Read more4/23/2024

0
Intents, Techniques, and Components: a Unified Analysis of Interaction Authoring Tasks in Data Visualization
Hyemi Song, Sai Gopinath, Zhicheng Liu
There is a growing interest in designing tools to support interactivity specification and authoring in data visualization. To develop expressive and flexible tools, we need theories and models that describe the task space of interaction authoring. Although multiple taxonomies and frameworks exist for interactive visualization, they primarily focus on how visualizations are used, not how interactivity is composed. To fill this gap, we conduct an analysis of 592 interaction units from 47 real-world visualization applications. Based on the analysis, we present a unified analysis of interaction authoring tasks across three levels of description: intents, representative techniques, and low-level implementation components. We examine our framework's descriptive, evaluative, and generative powers for critiquing existing interactivity authoring tools and informing new tool development.
Read more9/4/2024
0
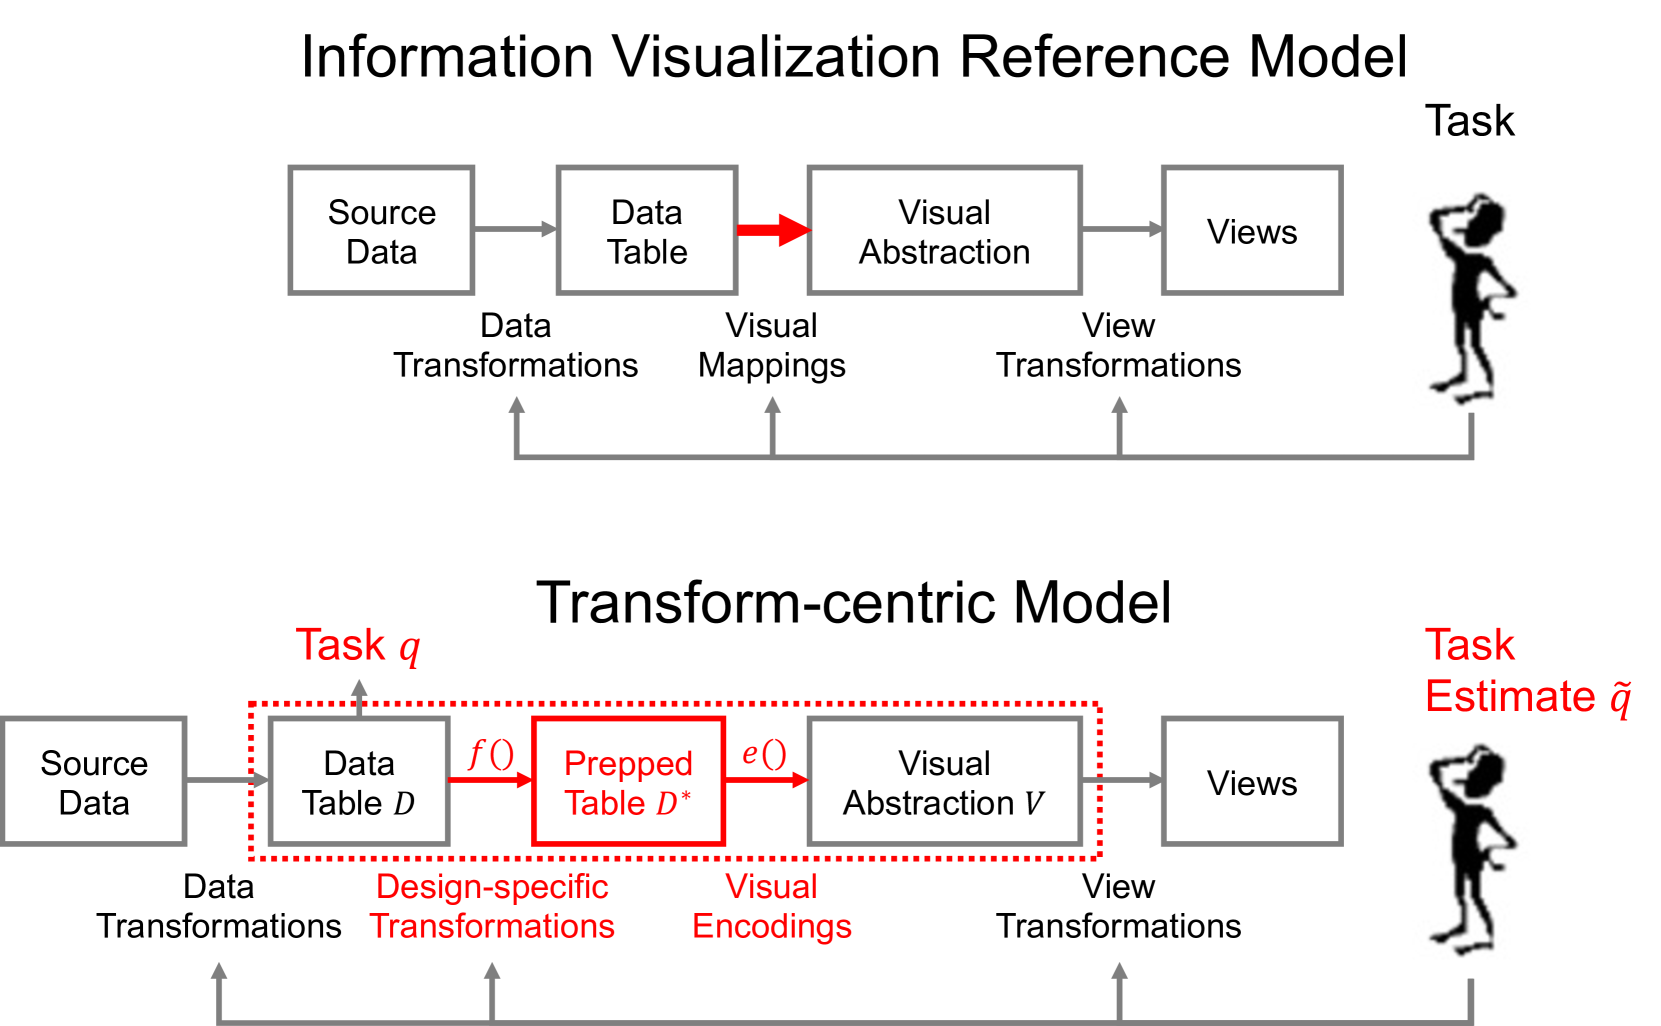
Design-Specific Transformations in Visualization
Eugene Wu, Remco Chang
In visualization, the process of transforming raw data into visually comprehensible representations is pivotal. While existing models like the Information Visualization Reference Model describe the data-to-visual mapping process, they often overlook a crucial intermediary step: design-specific transformations. This process, occurring after data transformation but before visual-data mapping, further derives data, such as groupings, layout, and statistics, that are essential to properly render the visualization. In this paper, we advocate for a deeper exploration of design-specific transformations, highlighting their importance in understanding visualization properties, particularly in relation to user tasks. We incorporate design-specific transformations into the Information Visualization Reference Model and propose a new formalism that encompasses the user task as a function over data. The resulting formalism offers three key benefits over existing visualization models: (1) describing task as compositions of functions, (2) enabling analysis of data transformations for visual-data mapping, and (3) empowering reasoning about visualization correctness and effectiveness. We further discuss the potential implications of this model on visualization theory and visualization experiment design.
Read more8/12/2024
0
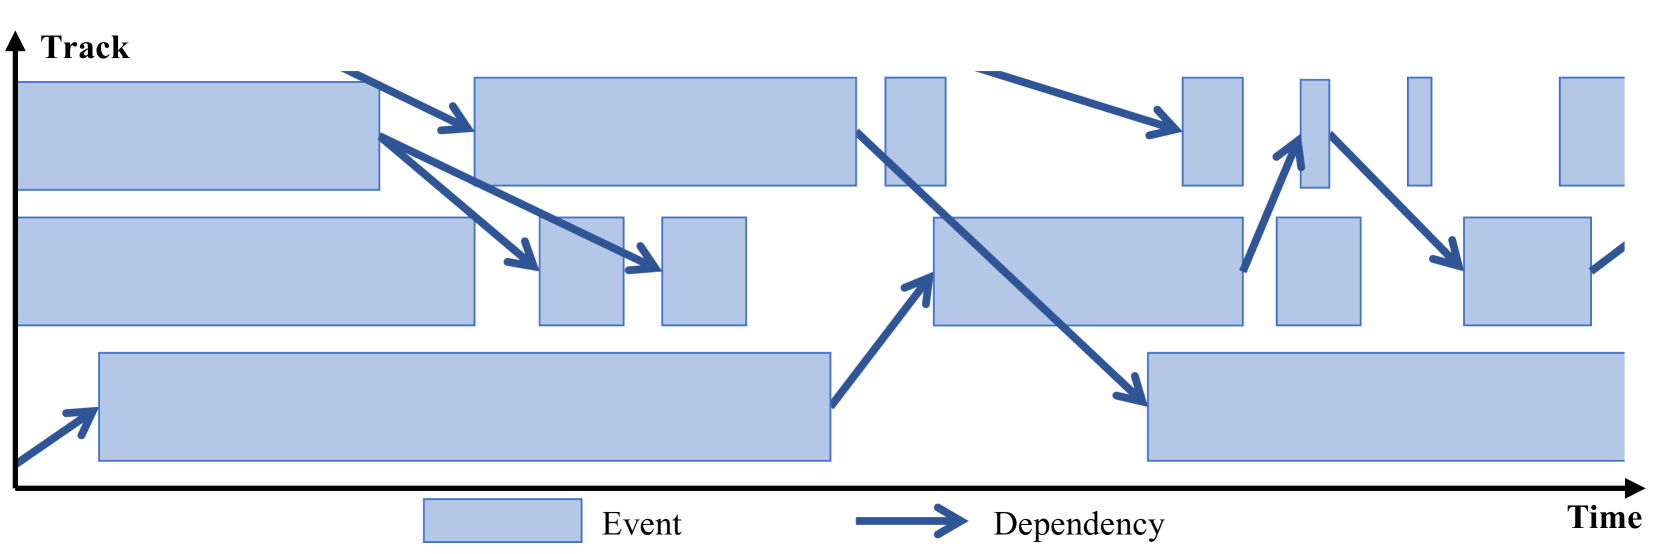
A Literature-based Visualization Task Taxonomy for Gantt Charts
Sayef Azad Sakin, Katherine E. Isaacs
Gantt charts are a widely-used idiom for visualizing temporal discrete event sequence data where dependencies exist between events. They are popular in domains such as manufacturing and computing for their intuitive layout of such data. However, these domains frequently generate data at scales which tax both the visual representation and the ability to render it at interactive speeds. To aid visualization developers who use Gantt charts in these situations, we develop a task taxonomy of low level visualization tasks supported by Gantt charts and connect them to the data queries needed to support them. Our taxonomy is derived through a literature survey of visualizations using Gantt charts over the past 30 years.
Read more8/22/2024