Intents, Techniques, and Components: a Unified Analysis of Interaction Authoring Tasks in Data Visualization

0

Sign in to get full access
Overview
- Provides a unified analysis of interaction authoring tasks in data visualization
- Identifies three key components: intents, techniques, and components
- Examines how these components work together to enable visualization interaction
Plain English Explanation
This paper presents a framework for understanding the core elements involved in designing interactive data visualizations. The researchers identified three key components:
-
Intents: The high-level goals or motivations that drive a user to interact with a visualization, such as exploring, filtering, or comparing data.
-
Techniques: The specific interaction methods or UI controls used to enable those intents, like panning, zooming, or brushing.
-
Components: The underlying visual and computational building blocks that make up the visualization, such as axes, legends, or data marks.
The paper explores how these three components work together to support different interaction scenarios. For example, a user may have the intent to explore a dataset. To enable this, the visualization could provide panning and zooming techniques that allow the user to navigate the data, which are powered by underlying data marks and axes components.
The researchers argue that by understanding the relationships between intents, techniques, and components, visualization designers can more systematically design interactive experiences to meet user needs.
Technical Explanation
The paper proposes a unified framework for analyzing interaction authoring tasks in data visualization. It identifies three key components:
-
Intents: The high-level user goals or motivations that drive interaction, such as exploring data, filtering information, or comparing data points.
-
Techniques: The specific interaction methods or UI controls used to enable those intents, like panning, zooming, or brushing.
-
Components: The underlying visual and computational building blocks that make up the visualization, such as axes, legends, or data marks.
The paper examines how these three elements work together to support different interaction scenarios. For example, a user may have the intent to explore a dataset. To enable this, the visualization could provide panning and zooming techniques that allow the user to navigate the data, which are powered by underlying data marks and axes components.
The researchers argue that by understanding the relationships between intents, techniques, and components, visualization designers can more systematically design interactive experiences to meet user needs.
Critical Analysis
The paper provides a comprehensive and well-structured framework for analyzing interaction authoring in data visualization. The clear delineation of intents, techniques, and components, as well as their interconnected relationships, offers a useful lens for designers to consider when developing interactive visualizations.
However, the framework could potentially be limited by its reliance on a predefined set of intents, techniques, and components. While the authors provide a thorough taxonomy, there may be emerging interaction paradigms or visualization elements that fall outside of the proposed model. Further research may be needed to assess the framework's adaptability to evolving visualization practices.
Additionally, the paper does not delve deeply into the cognitive and perceptual factors that influence how users interact with visualizations. Incorporating insights from human-computer interaction and visual cognition research could strengthen the framework's ability to predict and optimize user experiences.
Overall, the paper presents a valuable contribution to the field of interactive data visualization, but additional work may be needed to fully address the nuances and complexities of designing effective, user-centered interactive experiences.
Conclusion
This paper proposes a unified framework for analyzing interaction authoring tasks in data visualization. By identifying the key components of intents, techniques, and underlying visual and computational elements, the researchers offer a structured approach for visualization designers to systematically create interactive experiences that meet user needs.
The framework's clear delineation of these core components and their interrelationships provides a useful lens for understanding and designing interactive visualizations. While the model may benefit from further refinement and integration with human-centered design principles, it represents a significant step forward in the field of interactive data visualization.
This summary was produced with help from an AI and may contain inaccuracies - check out the links to read the original source documents!
Related Papers
0
Intents, Techniques, and Components: a Unified Analysis of Interaction Authoring Tasks in Data Visualization
Hyemi Song, Sai Gopinath, Zhicheng Liu
There is a growing interest in designing tools to support interactivity specification and authoring in data visualization. To develop expressive and flexible tools, we need theories and models that describe the task space of interaction authoring. Although multiple taxonomies and frameworks exist for interactive visualization, they primarily focus on how visualizations are used, not how interactivity is composed. To fill this gap, we conduct an analysis of 592 interaction units from 47 real-world visualization applications. Based on the analysis, we present a unified analysis of interaction authoring tasks across three levels of description: intents, representative techniques, and low-level implementation components. We examine our framework's descriptive, evaluative, and generative powers for critiquing existing interactivity authoring tools and informing new tool development.
Read more9/4/2024
0
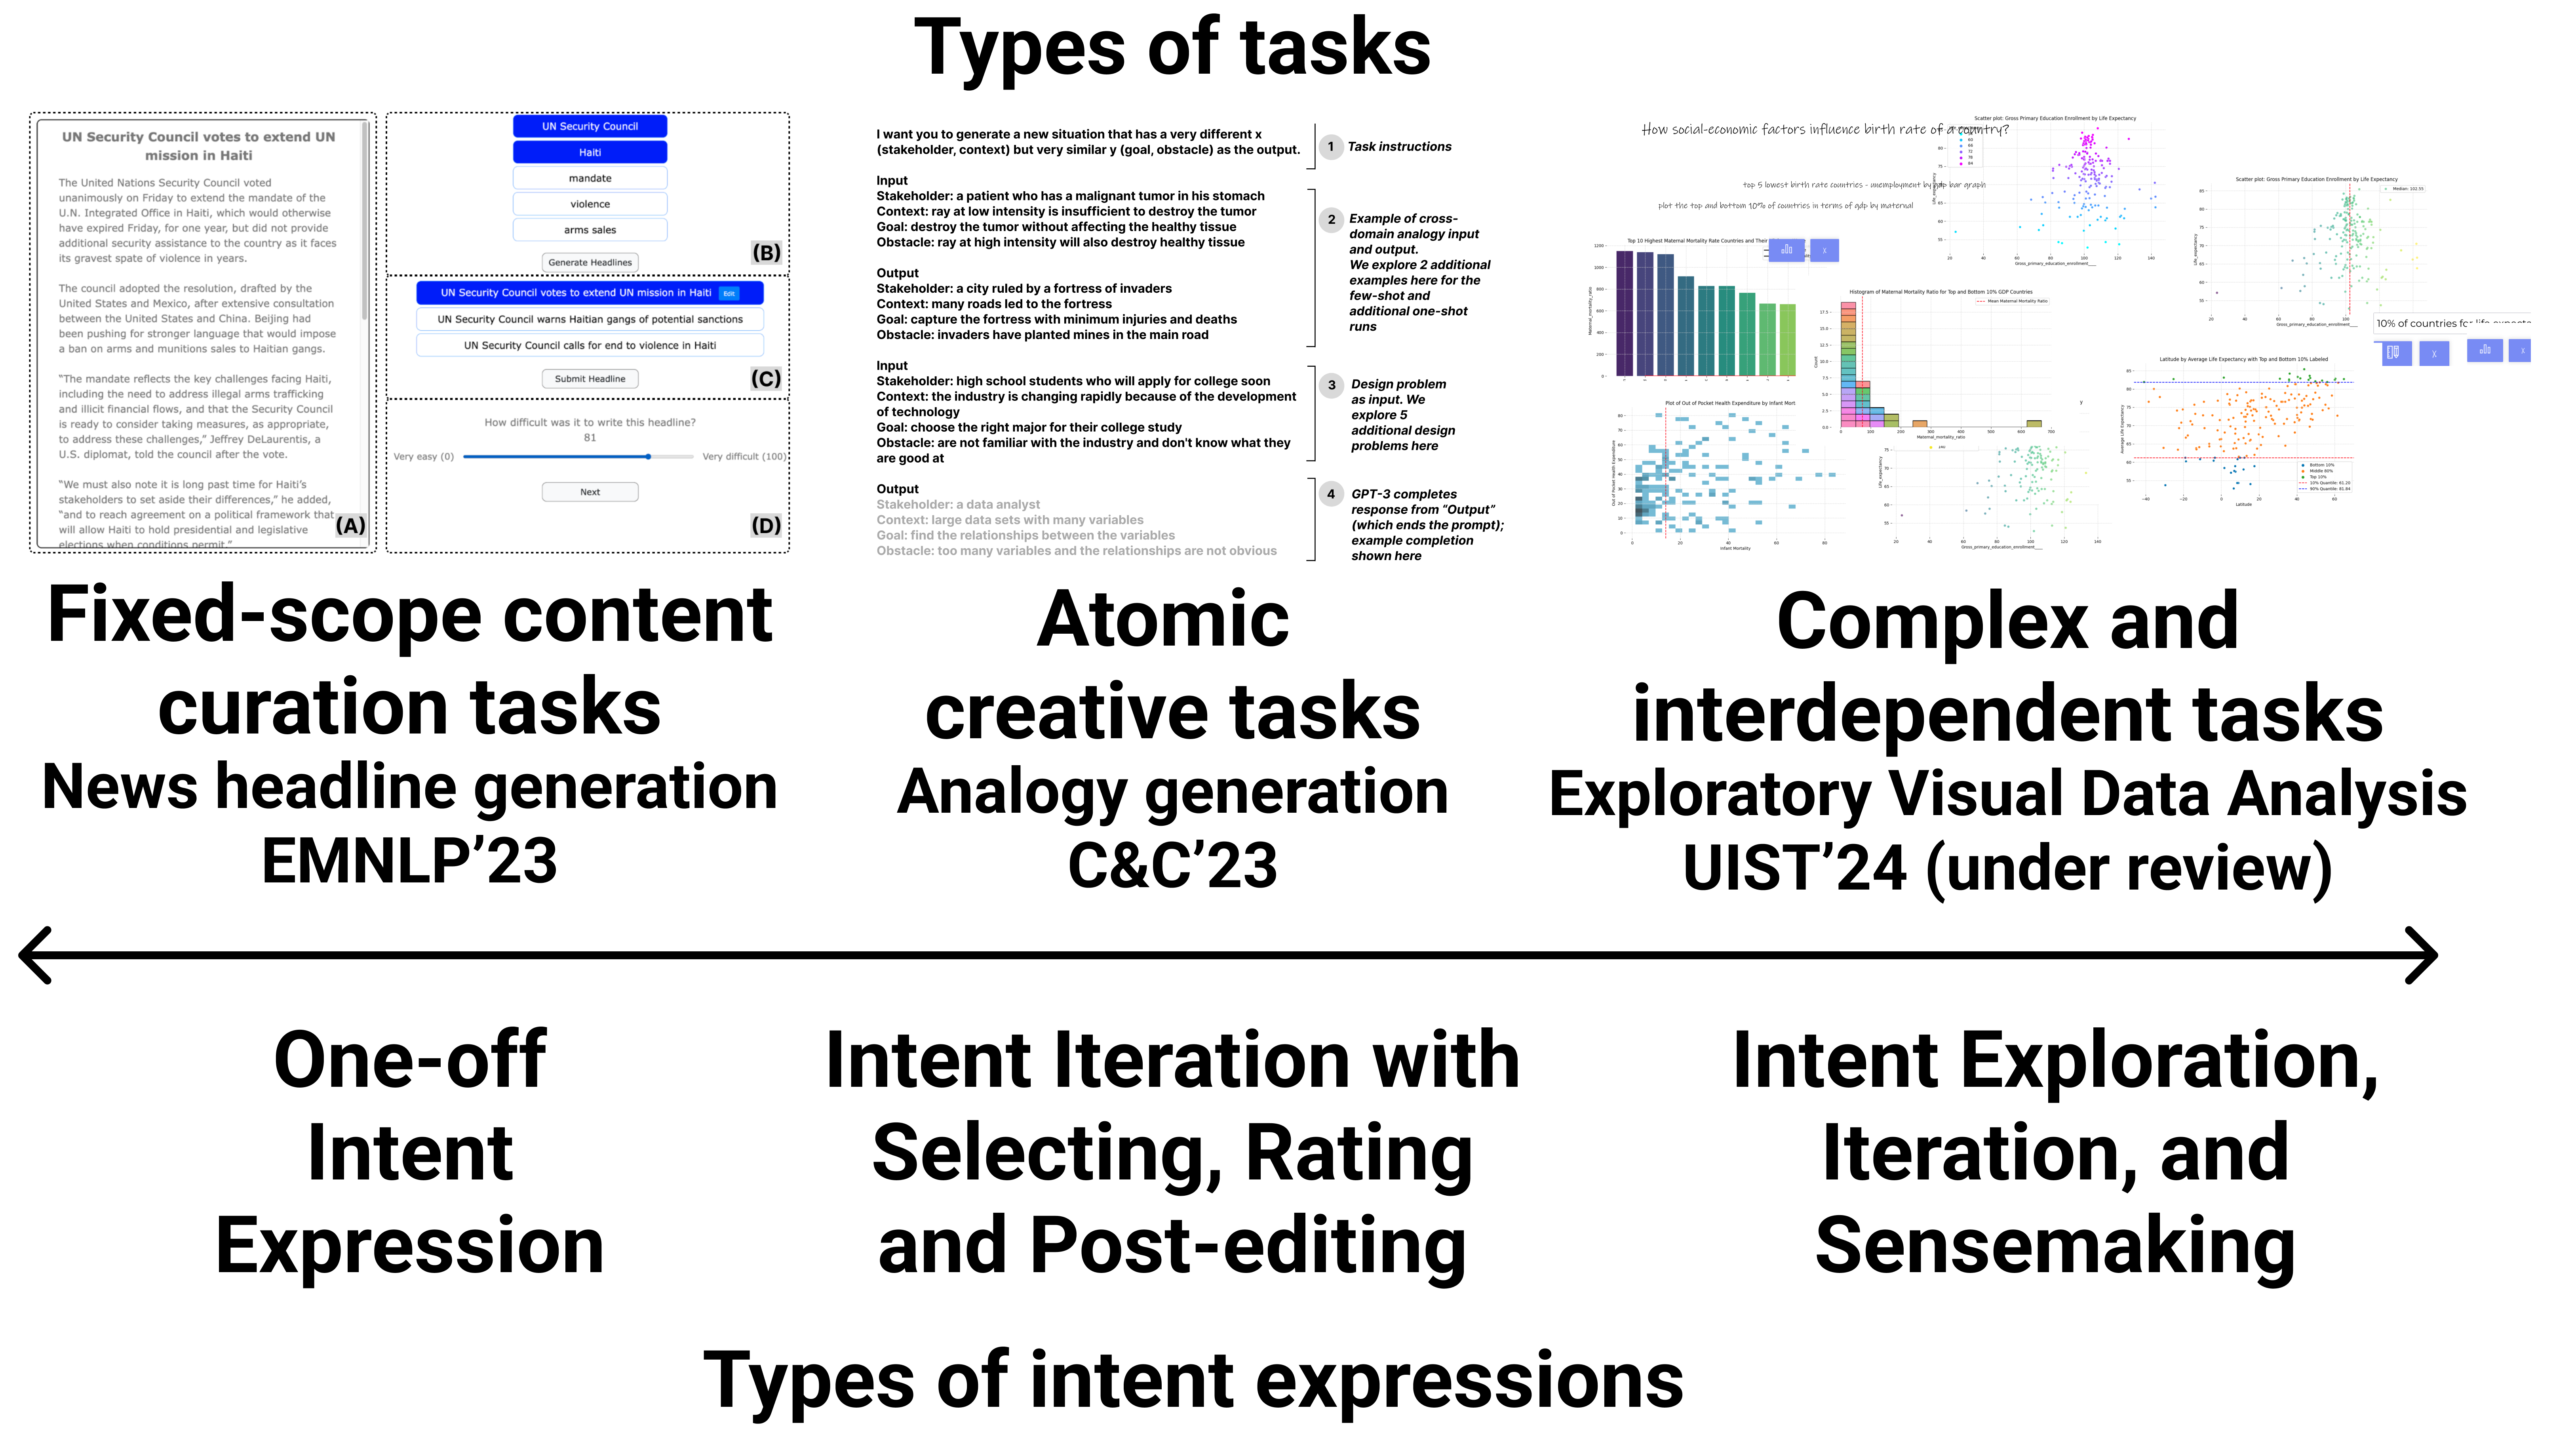
Towards Intent-based User Interfaces: Charting the Design Space of Intent-AI Interactions Across Task Types
Zijian Ding
Technological advances continue to redefine the dynamics of human-machine interactions, particularly in task execution. This proposal responds to the advancements in Generative AI by outlining a research plan that probes intent-AI interaction across a diverse set of tasks: fixed-scope content curation task, atomic creative tasks, and complex and interdependent tasks. This exploration aims to inform and contribute to the development of Intent-based User Interface (IUI). The study is structured in three phases: examining fixed-scope tasks through news headline generation, exploring atomic creative tasks via analogy generation, and delving into complex tasks through exploratory visual data analysis. Future work will focus on improving IUIs to better provide suggestions to encourage experienced users to express broad and exploratory intents, and detailed and structured guidance for novice users to iterate on analysis intents for high quality outputs.
Read more5/3/2024

0
A Multi-Level Task Framework for Event Sequence Analysis
Kazi Tasnim Zinat, Saimadhav Naga Sakhamuri, Aaron Sun Chen, Zhicheng Liu
Despite the development of numerous visual analytics tools for event sequence data across various domains, including but not limited to healthcare, digital marketing, and user behavior analysis, comparing these domain-specific investigations and transferring the results to new datasets and problem areas remain challenging. Task abstractions can help us go beyond domain-specific details, but existing visualization task abstractions are insufficient for event sequence visual analytics because they primarily focus on multivariate datasets and often overlook automated analytical techniques. To address this gap, we propose a domain-agnostic multi-level task framework for event sequence analytics, derived from an analysis of 58 papers that present event sequence visualization systems. Our framework consists of four levels: objective, intent, strategy, and technique. Overall objectives identify the main goals of analysis. Intents comprises five high-level approaches adopted at each analysis step: augment data, simplify data, configure data, configure visualization, and manage provenance. Each intent is accomplished through a number of strategies, for instance, data simplification can be achieved through aggregation, summarization, or segmentation. Finally, each strategy can be implemented by a set of techniques depending on the input and output components. We further show that each technique can be expressed through a quartet of action-input-output-criteria. We demonstrate the framework's descriptive power through case studies and discuss its similarities and differences with previous event sequence task taxonomies.
Read more8/12/2024

0
A Typology of Decision-Making Tasks for Visualization
Camelia D. Brumar, Sam Molnar, Gabriel Appleby, Kristi Potter, Remco Chang
Despite decision-making being a vital goal of data visualization, little work has been done to differentiate the decision-making tasks within our field. While visualization task taxonomies and typologies exist, they are often too granular for describing complex decision goals and decision-making processes, thus limiting their potential use in designing decision-support tools. In this paper, we contribute a typology of decision-making tasks that were iteratively refined from a list of design goals distilled from a literature review. Our typology is concise and consists of only three tasks: choose, activate, and create. Originally proposed by the scientific community, we extend and provide definitions for these tasks that are suitable for the visualization community. Our proposed typology offers two benefits. First, it facilitates the composition of decisions using these three tasks, allowing for flexible and clear descriptions across varying complexities and domains. Second, diagrams created using this typology encourage productive discourse between visualization designers and domain experts by abstracting the intricacies of data, thereby promoting clarity and rigorous analysis of decision-making processes. We motivate the use of our typology through four case studies and demonstrate the benefits of our approach through semi-structured interviews conducted with experienced members of the visualization community, comprising academic and industry experts, who have contributed to developing or publishing decision support systems for domain experts. Our interviewees composed diagrams using our typology to delineate the decision-making processes that drive their decision-support tools, demonstrating its descriptive capacity and effectiveness.
Read more4/23/2024