Interactive Explanation of Visual Patterns in Dimensionality Reductions with Predicate Logic

0

Sign in to get full access
Overview
- This paper introduces DimBridge, a tool for interactively exploring and explaining the visual patterns in dimensionality reduction techniques.
- DimBridge uses predicate logic to identify and highlight key relationships between data points in a dimensionality-reduced visualization.
- The goal is to provide users with a better understanding of why data points are arranged in a particular way and how different features contribute to the final visualization.
Plain English Explanation
Dimensionality reduction is a common technique used to visualize high-dimensional data in a lower-dimensional space, such as on a 2D plot. However, these reduced-dimension visualizations can be hard to interpret, as the complex relationships between data points may not be immediately clear.
DimBridge: Interactive Explanation of Visual Patterns in Dimensionality Reductions with Predicate Logic aims to address this by providing an interactive tool that uses predicate logic to identify and highlight the key drivers behind the visual patterns in a dimensionality-reduced plot.
The tool allows users to explore how different features of the data contribute to the final visualization, helping them understand why data points are arranged the way they are. This can be particularly useful when working with high-dimensional data, where the relationships between variables may not be immediately obvious.
By leveraging predicate logic, DimBridge can provide explanations that are both precise and intuitive, making it easier for users to grasp the underlying structure of the data and the reasons behind the observed patterns. This aligns with recent efforts in the field of interpretable machine learning to develop tools that can explain the decision-making of complex models in a more transparent and accessible way.
Technical Explanation
The key innovation of DimBridge is its use of predicate logic to identify and explain the visual patterns in dimensionality-reduced data visualizations. Predicate logic is a formal system of reasoning that allows for the precise and unambiguous representation of relationships between objects or concepts.
In the context of DimBridge, the authors use predicate logic to define a set of logical predicates that capture various properties and relationships between the data points in the dimensionality-reduced visualization. These predicates can represent things like proximity between data points, the presence of clusters, or the alignment of data points along certain directions.
The authors then develop algorithms to efficiently compute these predicate-based explanations and integrate them into an interactive visualization tool. Users can explore the data by selecting different predicate explanations, which are highlighted in the visualization to help them understand the underlying structure of the data.
This approach builds on previous work in the area of decision predicate graphs and formation-controlled dimensionality reduction, which have explored the use of interpretable models and logical constraints to enhance the transparency of dimensionality reduction techniques.
Critical Analysis
One key strength of the DimBridge approach is its ability to provide precise and intuitive explanations for the visual patterns observed in dimensionality-reduced data visualizations. By using predicate logic, the tool can capture complex relationships between data points in a way that is both mathematically rigorous and easy for users to understand.
However, the effectiveness of DimBridge's explanations may depend on the specific data and dimensionality reduction techniques being used. The authors acknowledge that the predicate logic-based approach may not be able to capture all the nuances of the data, and there may be cases where the explanations provided by the tool do not fully align with the user's intuition or domain knowledge.
Additionally, the computational overhead of computing the predicate-based explanations may be a limitation, particularly for large or high-dimensional datasets. The authors discuss some strategies to address this, such as the use of approximate algorithms, but further research may be needed to ensure the tool can scale to a wide range of real-world applications.
Enhancing dimension-reduced scatter plots with class-feature based explanations is another related approach that could be interesting to compare and potentially combine with the DimBridge methodology.
Conclusion
The DimBridge tool represents an important step forward in the field of high-dimensional data visualization and interpretability. By leveraging predicate logic to provide interactive explanations of the visual patterns in dimensionality-reduced plots, the tool can help users better understand the underlying structure of their data and the reasons behind the observed arrangements.
This type of interpretable dimensionality reduction technology has the potential to significantly enhance the usability and trustworthiness of data visualization tools, particularly in domains where complex, high-dimensional data is the norm. As the field of interpretable machine learning continues to evolve, we can expect to see more innovative approaches like DimBridge that aim to bridge the gap between the mathematical models and the human users who rely on them.
This summary was produced with help from an AI and may contain inaccuracies - check out the links to read the original source documents!
Related Papers
0
Interactive Explanation of Visual Patterns in Dimensionality Reductions with Predicate Logic
Brian Montambault, Gabriel Appleby, Jen Rogers, Camelia D. Brumar, Mingwei Li, Remco Chang
Dimensionality reduction techniques are widely used for visualizing high-dimensional data. However, support for interpreting patterns of dimension reduction results in the context of the original data space is often insufficient. Consequently, users may struggle to extract insights from the projections. In this paper, we introduce DimBridge, a visual analytics tool that allows users to interact with visual patterns in a projection and retrieve corresponding data patterns. DimBridge supports several interactions, allowing users to perform various analyses, from contrasting multiple clusters to explaining complex latent structures. Leveraging first-order predicate logic, DimBridge identifies subspaces in the original dimensions relevant to a queried pattern and provides an interface for users to visualize and interact with them. We demonstrate how DimBridge can help users overcome the challenges associated with interpreting visual patterns in projections.
Read more4/15/2024

0
DimVis: Interpreting Visual Clusters in Dimensionality Reduction With Explainable Boosting Machine
Parisa Salmanian, Angelos Chatzimparmpas, Ali Can Karaca, Rafael M. Martins
Dimensionality Reduction (DR) techniques such as t-SNE and UMAP are popular for transforming complex datasets into simpler visual representations. However, while effective in uncovering general dataset patterns, these methods may introduce artifacts and suffer from interpretability issues. This paper presents DimVis, a visualization tool that employs supervised Explainable Boosting Machine (EBM) models (trained on user-selected data of interest) as an interpretation assistant for DR projections. Our tool facilitates high-dimensional data analysis by providing an interpretation of feature relevance in visual clusters through interactive exploration of UMAP projections. Specifically, DimVis uses a contrastive EBM model that is trained in real time to differentiate between the data inside and outside a cluster of interest. Taking advantage of the inherent explainable nature of the EBM, we then use this model to interpret the cluster itself via single and pairwise feature comparisons in a ranking based on the EBM model's feature importance. The applicability and effectiveness of DimVis are demonstrated via a use case and a usage scenario with real-world data. We also discuss the limitations and potential directions for future research.
Read more4/19/2024
0
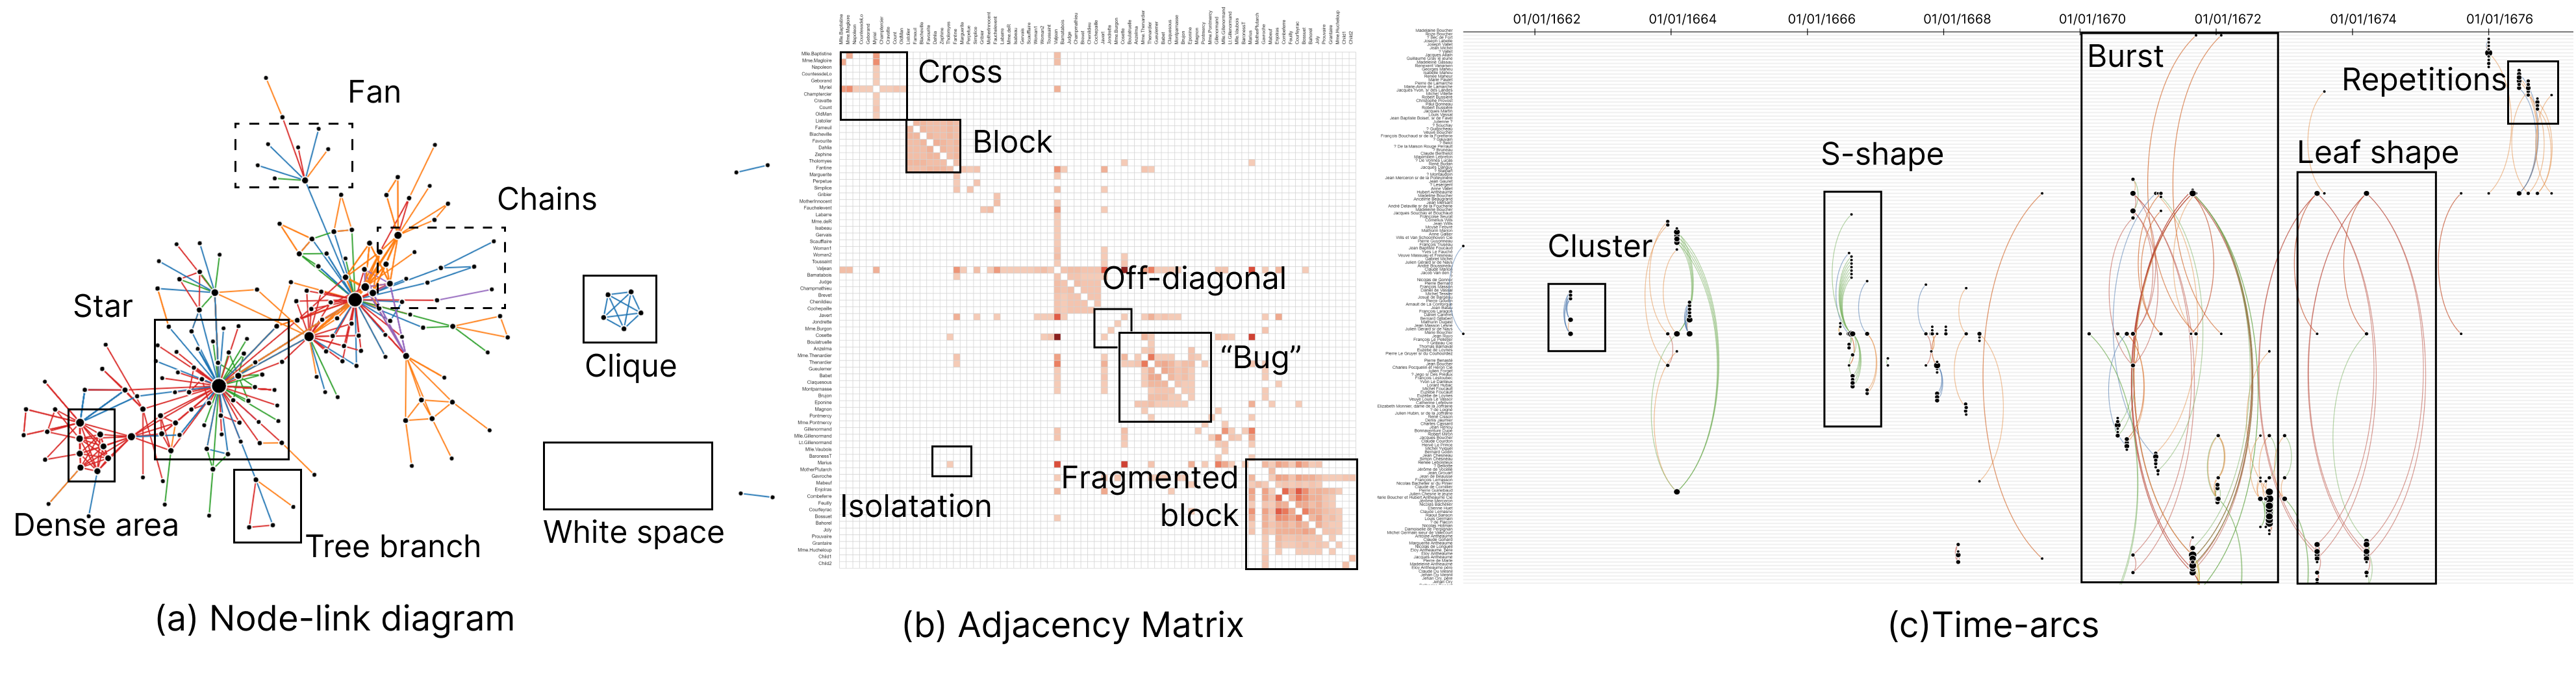
Does This Have a Particular Meaning? Interactive Pattern Explanation for Network Visualizations
Xinhuan Shu, Alexis Pister, Junxiu Tang, Fanny Chevalier, Benjamin Bach
This paper presents an interactive technique to explain visual patterns in network visualizations to analysts who do not understand these visualizations and who are learning to read them. Learning a visualization requires mastering its visual grammar and decoding information presented through visual marks, graphical encodings, and spatial configurations. To help people learn network visualization designs and extract meaningful information, we introduce the concept of interactive pattern explanation that allows viewers to select an arbitrary area in a visualization, then automatically mines the underlying data patterns, and explains both visual and data patterns present in the viewer's selection. In a qualitative and a quantitative user study with a total of 32 participants, we compare interactive pattern explanations to textual-only and visual-only (cheatsheets) explanations. Our results show that interactive explanations increase learning of i) unfamiliar visualizations, ii) patterns in network science, and iii) the respective network terminology.
Read more8/6/2024

0
Visualizing Spatial Semantics of Dimensionally Reduced Text Embeddings
Wei Liu, Chris North, Rebecca Faust
Dimension reduction (DR) can transform high-dimensional text embeddings into a 2D visual projection facilitating the exploration of document similarities. However, the projection often lacks connection to the text semantics, due to the opaque nature of text embeddings and non-linear dimension reductions. To address these problems, we propose a gradient-based method for visualizing the spatial semantics of dimensionally reduced text embeddings. This method employs gradients to assess the sensitivity of the projected documents with respect to the underlying words. The method can be applied to existing DR algorithms and text embedding models. Using these gradients, we designed a visualization system that incorporates spatial word clouds into the document projection space to illustrate the impactful text features. We further present three usage scenarios that demonstrate the practical applications of our system to facilitate the discovery and interpretation of underlying semantics in text projections.
Read more9/9/2024