Eyes on the Streets: Leveraging Street-Level Imaging to Model Urban Crime Dynamics
2404.10147
0
0

Abstract
This study addresses the challenge of urban safety in New York City by examining the relationship between the built environment and crime rates using machine learning and a comprehensive dataset of street view im- ages. We aim to identify how urban landscapes correlate with crime statistics, focusing on the characteristics of street views and their association with crime rates. The findings offer insights for urban planning and crime pre- vention, highlighting the potential of environmental de- sign in enhancing public safety.
Create account to get full access
Overview
- This research paper explores how street-level imagery can be leveraged to model urban crime dynamics.
- The study utilizes datasets from Google Street View and public crime records to analyze the relationship between visual features of a neighborhood and its crime rates.
- The aim is to develop a framework for predicting crime patterns based on the visual characteristics of an area, which could inform urban planning and policing strategies.
Plain English Explanation
The paper investigates whether the visual appearance of a city neighborhood, as captured by Google Street View images, can provide insights into the crime rates in that area. The researchers gathered data on both the visual features (e.g., the presence of graffiti, abandoned buildings, or well-maintained storefronts) and the actual crime statistics for different neighborhoods. By analyzing this data, the team sought to identify patterns that could help predict the crime levels in a given area based solely on its visual characteristics.
The motivation behind this research is to give urban planners and law enforcement officials a new tool to understand and potentially address crime dynamics in cities. If certain visual cues are consistently linked to higher or lower crime rates, then targeted interventions, such as improving the physical appearance of a neighborhood, could be an effective crime-reduction strategy. This could complement traditional policing approaches and help create safer, more vibrant communities.
Technical Explanation
The researchers used a combination of Google Street View imagery and public crime data to build a predictive model for urban crime. They first extracted a range of visual features from the street-level images, such as the presence of graffiti, abandoned buildings, and commercial activity. These features were then used as inputs to train a machine learning model to predict the crime rates in a given neighborhood.
The team experimented with different model architectures, including convolutional neural networks (CNNs) and transfer learning approaches, to find the most effective way to leverage the street-level imagery. They also incorporated additional contextual data, such as demographic information and socioeconomic indicators, to further improve the model's predictive accuracy.
Through their experiments, the researchers were able to demonstrate a strong correlation between the visual characteristics of a neighborhood and its crime levels. The model was able to accurately predict crime patterns based solely on the street-level imagery, suggesting that these visual cues can provide valuable insights into urban crime dynamics.
Critical Analysis
The research presented in this paper offers a promising approach to modeling urban crime, but it also raises some important considerations and limitations. One key issue is the potential for biases and stereotypes to be reflected in the model's predictions, as the visual features used to predict crime may be influenced by societal perceptions and prejudices. The authors acknowledge this concern and suggest that further research is needed to ensure the fairness and robustness of the models.
Another limitation is the reliance on Google Street View imagery, which may not capture the full complexity of a neighborhood's visual landscape. The researchers note that this data source has its own biases and may not be representative of all areas, particularly in underserved or marginalized communities. Incorporating additional data sources, such as community-generated imagery, could help to address this issue and provide a more comprehensive view of the urban environment.
Despite these caveats, the overall approach presented in the paper has significant potential to inform urban planning and crime-reduction strategies. By leveraging street-level imagery, policymakers and law enforcement could gain valuable insights into the relationship between the physical environment and crime patterns, which could lead to more targeted and effective interventions.
Conclusion
This research paper demonstrates the potential of using street-level imagery to model and predict urban crime dynamics. By combining visual data from Google Street View with public crime records, the researchers were able to develop a predictive model that can identify patterns between a neighborhood's physical characteristics and its crime rates.
While the study raises important considerations around bias and the limitations of the data sources, the overall approach offers a promising avenue for informing urban planning and policing strategies. By understanding the visual cues that correlate with crime, policymakers and community leaders can explore targeted interventions to create safer and more vibrant neighborhoods. As the field of computer vision and urban analytics continues to evolve, this type of research could have significant implications for improving the quality of life in cities around the world.
This summary was produced with help from an AI and may contain inaccuracies - check out the links to read the original source documents!
Related Papers

A citizen science toolkit to collect human perceptions of urban environments using open street view images
Matthew Danish, SM Labib, Britta Ricker, Marco Helbich
0
0
Street View Imagery (SVI) is a valuable data source for studies (e.g., environmental assessments, green space identification or land cover classification). While commercial SVI is available, such providers commonly restrict copying or reuse in ways necessary for research. Open SVI datasets are readily available from less restrictive sources, such as Mapillary, but due to the heterogeneity of the images, these require substantial preprocessing, filtering, and careful quality checks. We present an efficient method for automated downloading, processing, cropping, and filtering open SVI, to be used in a survey of human perceptions of the streets portrayed in these images. We demonstrate our open-source reusable SVI preparation and smartphone-friendly perception-survey software with Amsterdam (Netherlands) as the case study. Using a citizen science approach, we collected from 331 people 22,637 ratings about their perceptions for various criteria. We have published our software in a public repository for future re-use and reproducibility.
6/4/2024
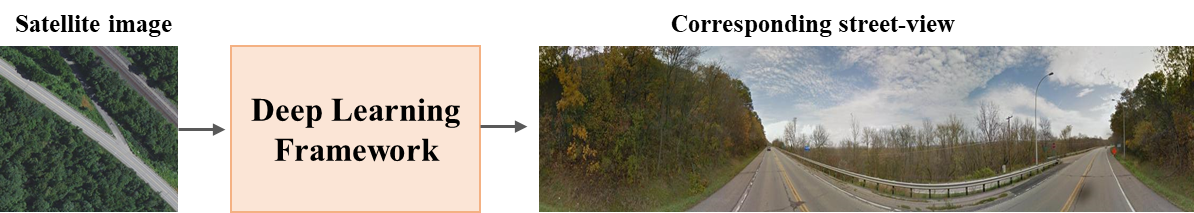
Bird's-Eye View to Street-View: A Survey
Khawlah Bajbaa, Muhammad Usman, Saeed Anwar, Ibrahim Radwan, Abdul Bais
0
0
In recent years, street view imagery has grown to become one of the most important sources of geospatial data collection and urban analytics, which facilitates generating meaningful insights and assisting in decision-making. Synthesizing a street-view image from its corresponding satellite image is a challenging task due to the significant differences in appearance and viewpoint between the two domains. In this study, we screened 20 recent research papers to provide a thorough review of the state-of-the-art of how street-view images are synthesized from their corresponding satellite counterparts. The main findings are: (i) novel deep learning techniques are required for synthesizing more realistic and accurate street-view images; (ii) more datasets need to be collected for public usage; and (iii) more specific evaluation metrics need to be investigated for evaluating the generated images appropriately. We conclude that, due to applying outdated deep learning techniques, the recent literature failed to generate detailed and diverse street-view images.
5/16/2024

ELSA: Evaluating Localization of Social Activities in Urban Streets
Maryam Hosseini, Marco Cipriano, Sedigheh Eslami, Daniel Hodczak, Liu Liu, Andres Sevtsuk, Gerard de Melo
0
0
Why do some streets attract more social activities than others? Is it due to street design, or do land use patterns in neighborhoods create opportunities for businesses where people gather? These questions have intrigued urban sociologists, designers, and planners for decades. Yet, most research in this area has remained limited in scale, lacking a comprehensive perspective on the various factors influencing social interactions in urban settings. Exploring these issues requires fine-level data on the frequency and variety of social interactions on urban street. Recent advances in computer vision and the emergence of the open-vocabulary detection models offer a unique opportunity to address this long-standing issue on a scale that was previously impossible using traditional observational methods. In this paper, we propose a new benchmark dataset for Evaluating Localization of Social Activities (ELSA) in urban street images. ELSA draws on theoretical frameworks in urban sociology and design. While majority of action recognition datasets are collected in controlled settings, we use in-the-wild street-level imagery, where the size of social groups and the types of activities can vary significantly. ELSA includes 937 manually annotated images with more than 4,300 multi-labeled bounding boxes for individual and group activities, categorized into three primary groups: Condition, State, and Action. Each category contains various sub-categories, e.g., alone or group under Condition category, standing or walking, which fall under the State category, and talking or dining with regards to the Action category. ELSA is publicly available for the research community.
6/4/2024
📈
Computer vision-based model for detecting turning lane features on Florida's public roadways
Richard Boadu Antwi, Samuel Takyi, Kimollo Michael, Alican Karaer, Eren Erman Ozguven, Ren Moses, Maxim A. Dulebenets, Thobias Sando
0
0
Efficient and current roadway geometry data collection is critical to transportation agencies in road planning, maintenance, design, and rehabilitation. Data collection methods are divided into land-based and aerial-based. Land-based methods for extensive highway networks are tedious, costly, pose safety risks. Therefore, there is the need for efficient, safe, and economical data acquisition methodologies. The rise of computer vision and object detection technologies have made automated extraction of roadway geometry features feasible. This study detects roadway features on Florida's public roads from high-resolution aerial images using AI. The developed model achieved an average accuracy of 80.4 percent when compared with ground truth data. The extracted roadway geometry data can be integrated with crash and traffic data to provide valuable insights to policymakers and roadway users.
6/14/2024