Interactive Counterfactual Generation for Univariate Time Series

0
Sign in to get full access
Overview
- This technical paper describes an interactive system for generating counterfactual explanations for univariate time series models.
- Counterfactual explanations show how an AI model's prediction would change if certain input features were modified.
- The proposed system allows users to interactively explore how modifying the input time series can lead to different model predictions.
Plain English Explanation
Imagine you have a machine learning model that can predict some future value based on a series of past measurements over time - for example, a model that predicts the weather tomorrow based on the weather patterns of the last few days. Counterfactual explanations allow you to understand how the model made its prediction by showing what would happen if you changed certain parts of the input data.
In this paper, the researchers developed an interactive system that makes it easy to explore counterfactual explanations for time series models. Instead of just seeing the original prediction, you can use the system to modify the input time series data and instantly see how the model's prediction changes. This allows you to better understand the model's reasoning and identify which parts of the input data are most influential.
For example, you could use the system to see what the weather prediction would be if the temperature was 5 degrees warmer on a particular day. Or you could see how the prediction changes if you increase the wind speed on a certain day. The interactive nature of the system makes it easy to experiment and gain insights into how the model works.
This type of interpretable AI system can be very useful in real-world applications where it's important to understand and trust the model's decision-making process, such as in medical diagnosis, financial forecasting, or climate modeling. By making the model's logic more transparent, these counterfactual explanations can help build user confidence and identify potential biases or limitations in the model.
Technical Explanation
The paper presents an interactive counterfactual generation system for univariate time series models. The key components of the system are:
- Time Series Encoder: This module takes the input time series and encodes it into a latent representation that can be used by the downstream models.
- Counterfactual Generator: This is the core of the system, responsible for generating counterfactual time series based on the user's interactive modifications. It uses an optimization-based approach to find the minimal changes to the input that would lead to a different model prediction.
- Explainability Module: This module visualizes the counterfactual explanations, allowing users to interactively explore how the model's prediction changes as they modify the input time series.
The researchers evaluated their system on several univariate time series classification tasks, including forecasting electricity consumption and predicting stock prices. They found that the interactive counterfactual explanations provided useful insights into the model's decision-making process and helped users better understand the factors driving the predictions.
Critical Analysis
The paper presents a novel and potentially valuable approach for improving the interpretability of time series models. By allowing users to interactively explore counterfactual scenarios, the system can help build trust in the model's predictions and identify potential biases or limitations.
One potential limitation of the approach is that it may be computationally intensive to generate the counterfactual explanations, especially for large or complex time series data. The paper does not provide detailed performance metrics or scalability analysis, so it's unclear how well the system would scale to real-world, high-stakes applications.
Additionally, the paper focuses on univariate time series, but many real-world time series datasets are multivariate in nature. Extending the approach to handle multivariate data could be an important area for future research.
Overall, the paper makes a valuable contribution to the field of interpretable AI by demonstrating the potential of interactive counterfactual explanations for time series models. Further research and development in this area could lead to more trustworthy and transparent AI systems in a wide range of applications.
Conclusion
This paper presents an interactive system for generating counterfactual explanations for univariate time series models. By allowing users to interactively modify the input time series and see how the model's predictions change, the system can provide valuable insights into the model's decision-making process.
The proposed approach has the potential to improve trust and transparency in time series models, which are widely used in fields like finance, healthcare, and climate modeling. While the current system is limited to univariate data, extending it to handle multivariate time series could further expand its real-world applicability.
Overall, this research represents an important step towards building more interpretable and explainable AI systems that can better support human decision-making and help identify potential biases or limitations in machine learning models.
This summary was produced with help from an AI and may contain inaccuracies - check out the links to read the original source documents!
Related Papers
0
Interactive Counterfactual Generation for Univariate Time Series
Udo Schlegel, Julius Rauscher, Daniel A. Keim
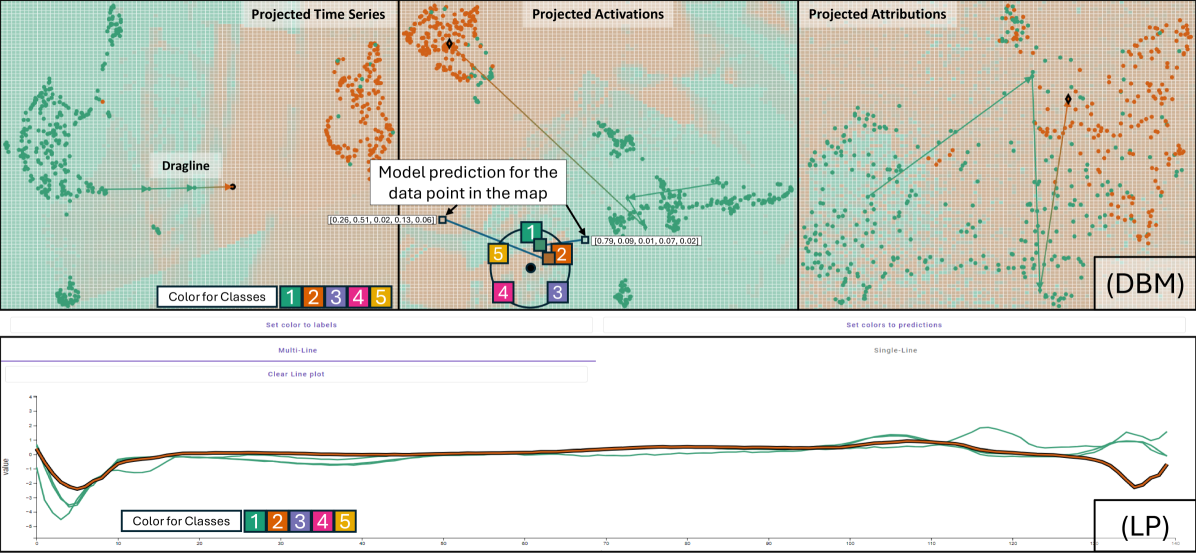
We propose an interactive methodology for generating counterfactual explanations for univariate time series data in classification tasks by leveraging 2D projections and decision boundary maps to tackle interpretability challenges. Our approach aims to enhance the transparency and understanding of deep learning models' decision processes. The application simplifies the time series data analysis by enabling users to interactively manipulate projected data points, providing intuitive insights through inverse projection techniques. By abstracting user interactions with the projected data points rather than the raw time series data, our method facilitates an intuitive generation of counterfactual explanations. This approach allows for a more straightforward exploration of univariate time series data, enabling users to manipulate data points to comprehend potential outcomes of hypothetical scenarios. We validate this method using the ECG5000 benchmark dataset, demonstrating significant improvements in interpretability and user understanding of time series classification. The results indicate a promising direction for enhancing explainable AI, with potential applications in various domains requiring transparent and interpretable deep learning models. Future work will explore the scalability of this method to multivariate time series data and its integration with other interpretability techniques.
Read more8/21/2024

0
Benchmarking Counterfactual Interpretability in Deep Learning Models for Time Series Classification
Ziwen Kan, Shahbaz Rezaei, Xin liu
The popularity of deep learning methods in the time series domain boosts interest in interpretability studies, including counterfactual (CF) methods. CF methods identify minimal changes in instances to alter the model predictions. Despite extensive research, no existing work benchmarks CF methods in the time series domain. Additionally, the results reported in the literature are inconclusive due to the limited number of datasets and inadequate metrics. In this work, we redesign quantitative metrics to accurately capture desirable characteristics in CFs. We specifically redesign the metrics for sparsity and plausibility and introduce a new metric for consistency. Combined with validity, generation time, and proximity, we form a comprehensive metric set. We systematically benchmark 6 different CF methods on 20 univariate datasets and 10 multivariate datasets with 3 different classifiers. Results indicate that the performance of CF methods varies across metrics and among different models. Finally, we provide case studies and a guideline for practical usage.
Read more8/26/2024

0
Counterfactual Explanations for Multivariate Time-Series without Training Datasets
Xiangyu Sun, Raquel Aoki, Kevin H. Wilson
Machine learning (ML) methods have experienced significant growth in the past decade, yet their practical application in high-impact real-world domains has been hindered by their opacity. When ML methods are responsible for making critical decisions, stakeholders often require insights into how to alter these decisions. Counterfactual explanations (CFEs) have emerged as a solution, offering interpretations of opaque ML models and providing a pathway to transition from one decision to another. However, most existing CFE methods require access to the model's training dataset, few methods can handle multivariate time-series, and none can handle multivariate time-series without training datasets. These limitations can be formidable in many scenarios. In this paper, we present CFWoT, a novel reinforcement-learning-based CFE method that generates CFEs when training datasets are unavailable. CFWoT is model-agnostic and suitable for both static and multivariate time-series datasets with continuous and discrete features. Users have the flexibility to specify non-actionable, immutable, and preferred features, as well as causal constraints which CFWoT guarantees will be respected. We demonstrate the performance of CFWoT against four baselines on several datasets and find that, despite not having access to a training dataset, CFWoT finds CFEs that make significantly fewer and significantly smaller changes to the input time-series. These properties make CFEs more actionable, as the magnitude of change required to alter an outcome is vastly reduced.
Read more5/30/2024
🏋️
0
Interactive Analysis of LLMs using Meaningful Counterfactuals
Furui Cheng, Vil'em Zouhar, Robin Shing Moon Chan, Daniel Furst, Hendrik Strobelt, Mennatallah El-Assady
Counterfactual examples are useful for exploring the decision boundaries of machine learning models and determining feature attributions. How can we apply counterfactual-based methods to analyze and explain LLMs? We identify the following key challenges. First, the generated textual counterfactuals should be meaningful and readable to users and thus can be mentally compared to draw conclusions. Second, to make the solution scalable to long-form text, users should be equipped with tools to create batches of counterfactuals from perturbations at various granularity levels and interactively analyze the results. In this paper, we tackle the above challenges and contribute 1) a novel algorithm for generating batches of complete and meaningful textual counterfactuals by removing and replacing text segments in different granularities, and 2) LLM Analyzer, an interactive visualization tool to help users understand an LLM's behaviors by interactively inspecting and aggregating meaningful counterfactuals. We evaluate the proposed algorithm by the grammatical correctness of its generated counterfactuals using 1,000 samples from medical, legal, finance, education, and news datasets. In our experiments, 97.2% of the counterfactuals are grammatically correct. Through a use case, user studies, and feedback from experts, we demonstrate the usefulness and usability of the proposed interactive visualization tool.
Read more5/3/2024