Interactive dense pixel visualizations for time series and model attribution explanations

0
📈
Sign in to get full access
Overview
- The field of Explainable Artificial Intelligence (XAI) has developed techniques to extract explanations from deep neural network models.
- Evaluating these explanations can be challenging, especially for non-intelligible data like time series.
- There is a need for visualizations tailored to explore explanations for domains with such data.
Plain English Explanation
The paper presents an interactive visual analytics approach called DAVOTS to help users understand the inner workings of deep neural network models trained on time series data. Time series data, like stock prices or sensor readings, can be complex and difficult to interpret.
DAVOTS allows users to visualize the raw time series data, the activations (or signals) within the neural network as it processes the data, and the attributions (or explanations) the model uses to make decisions. By combining these different views, users can gain insights into both the data itself and how the model is making sense of it.
To make it easier to explore large datasets, DAVOTS also applies clustering techniques to group similar data points and presents ordering strategies to help users find patterns more easily. The paper demonstrates DAVOTS using a convolutional neural network trained on the FordA dataset, which contains time series data.
Technical Explanation
The paper proposes an interactive visual analytics approach called DAVOTS to explore raw time series data, activations of neural networks, and attributions (explanations) in a dense-pixel visualization. This allows users to gain insights into the data, the models' decisions, and the explanations provided by the models.
To support exploration of large datasets, the authors apply clustering approaches to the visualized data domains to highlight groups of similar data points. They also present ordering strategies for individual and combined data exploration to help users more easily identify patterns in the data and model behavior.
The paper demonstrates the DAVOTS approach using a convolutional neural network (CNN) trained on the FordA dataset, which contains time series data. The visualizations provide a comprehensive view of the data, model activations, and attributions, allowing users to better understand the model's decision-making process.
Critical Analysis
The paper addresses an important challenge in the field of Explainable AI (XAI) - the need for effective visualizations to explore explanations for complex, non-intelligible data like time series. The authors propose a novel and interactive approach that combines multiple views to enable users to gain insights into both the data and the model's behavior.
One potential limitation of the work is the reliance on clustering and ordering strategies to manage large datasets. While these techniques can be helpful, they may not always capture all the nuances and patterns in the data. Additionally, the paper does not provide a thorough evaluation of the effectiveness of these strategies or the overall DAVOTS approach.
Further research could explore the generalizability of the DAVOTS approach to other domains, as well as the development of more advanced techniques for handling large-scale time series data and model explanations. Comparing DAVOTS to other XAI visualization approaches could also help assess its relative strengths and weaknesses.
Conclusion
The paper presents an innovative visual analytics approach called DAVOTS that aims to facilitate the exploration and understanding of deep neural network models trained on time series data. By combining visualizations of the raw data, model activations, and attributions, DAVOTS provides a comprehensive view that can help users gain insights into the data and the models' decision-making processes.
The work addresses an important challenge in the field of Explainable AI and demonstrates the potential for interactive visualizations to support the interpretation of complex, non-intelligible data. Further research is needed to fully evaluate the approach and explore its wider applicability, but the DAVOTS system represents a promising step forward in making deep learning models more transparent and understandable.
This summary was produced with help from an AI and may contain inaccuracies - check out the links to read the original source documents!
Related Papers
📈
0
Interactive dense pixel visualizations for time series and model attribution explanations
Udo Schlegel, Daniel A. Keim
The field of Explainable Artificial Intelligence (XAI) for Deep Neural Network models has developed significantly, offering numerous techniques to extract explanations from models. However, evaluating explanations is often not trivial, and differences in applied metrics can be subtle, especially with non-intelligible data. Thus, there is a need for visualizations tailored to explore explanations for domains with such data, e.g., time series. We propose DAVOTS, an interactive visual analytics approach to explore raw time series data, activations of neural networks, and attributions in a dense-pixel visualization to gain insights into the data, models' decisions, and explanations. To further support users in exploring large datasets, we apply clustering approaches to the visualized data domains to highlight groups and present ordering strategies for individual and combined data exploration to facilitate finding patterns. We visualize a CNN trained on the FordA dataset to demonstrate the approach.
Read more8/28/2024

0
Explanation Space: A New Perspective into Time Series Interpretability
Shahbaz Rezaei, Xin Liu
Human understandable explanation of deep learning models is necessary for many critical and sensitive applications. Unlike image or tabular data where the importance of each input feature (for the classifier's decision) can be directly projected into the input, time series distinguishable features (e.g. dominant frequency) are often hard to manifest in time domain for a user to easily understand. Moreover, most explanation methods require a baseline value as an indication of the absence of any feature. However, the notion of lack of feature, which is often defined as black pixels for vision tasks or zero/mean values for tabular data, is not well-defined in time series. Despite the adoption of explainable AI methods (XAI) from tabular and vision domain into time series domain, these differences limit the application of these XAI methods in practice. In this paper, we propose a simple yet effective method that allows a model originally trained on time domain to be interpreted in other explanation spaces using existing methods. We suggest four explanation spaces that each can potentially alleviate these issues in certain types of time series. Our method can be readily adopted in existing platforms without any change to trained models or XAI methods. The code is available at https://github.com/shrezaei/TS-X-spaces.
Read more9/6/2024
0
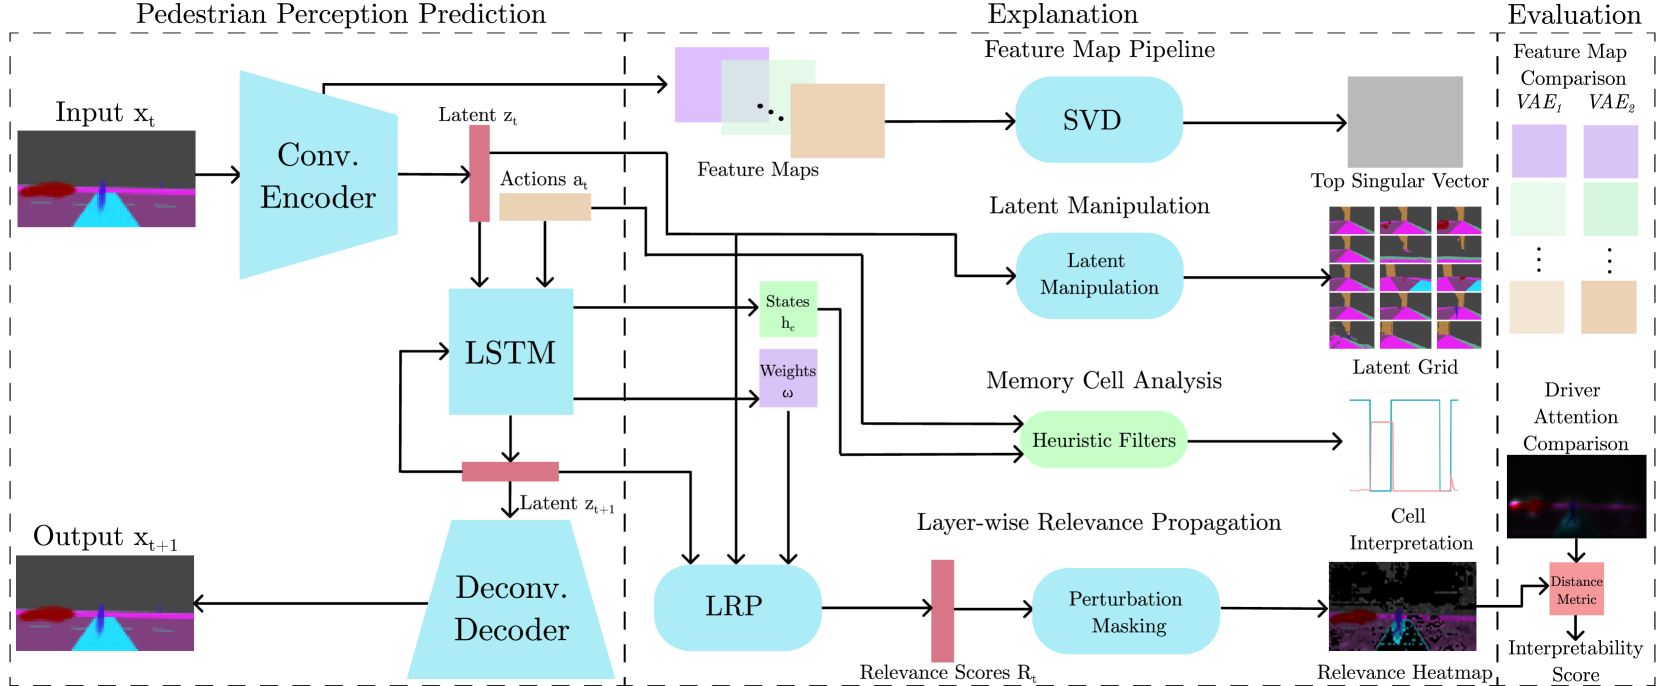
On the Road to Clarity: Exploring Explainable AI for World Models in a Driver Assistance System
Mohamed Roshdi, Julian Petzold, Mostafa Wahby, Hussein Ebrahim, Mladen Berekovic, Heiko Hamann
In Autonomous Driving (AD) transparency and safety are paramount, as mistakes are costly. However, neural networks used in AD systems are generally considered black boxes. As a countermeasure, we have methods of explainable AI (XAI), such as feature relevance estimation and dimensionality reduction. Coarse graining techniques can also help reduce dimensionality and find interpretable global patterns. A specific coarse graining method is Renormalization Groups from statistical physics. It has previously been applied to Restricted Boltzmann Machines (RBMs) to interpret unsupervised learning. We refine this technique by building a transparent backbone model for convolutional variational autoencoders (VAE) that allows mapping latent values to input features and has performance comparable to trained black box VAEs. Moreover, we propose a custom feature map visualization technique to analyze the internal convolutional layers in the VAE to explain internal causes of poor reconstruction that may lead to dangerous traffic scenarios in AD applications. In a second key contribution, we propose explanation and evaluation techniques for the internal dynamics and feature relevance of prediction networks. We test a long short-term memory (LSTM) network in the computer vision domain to evaluate the predictability and in future applications potentially safety of prediction models. We showcase our methods by analyzing a VAE-LSTM world model that predicts pedestrian perception in an urban traffic situation.
Read more4/29/2024
0
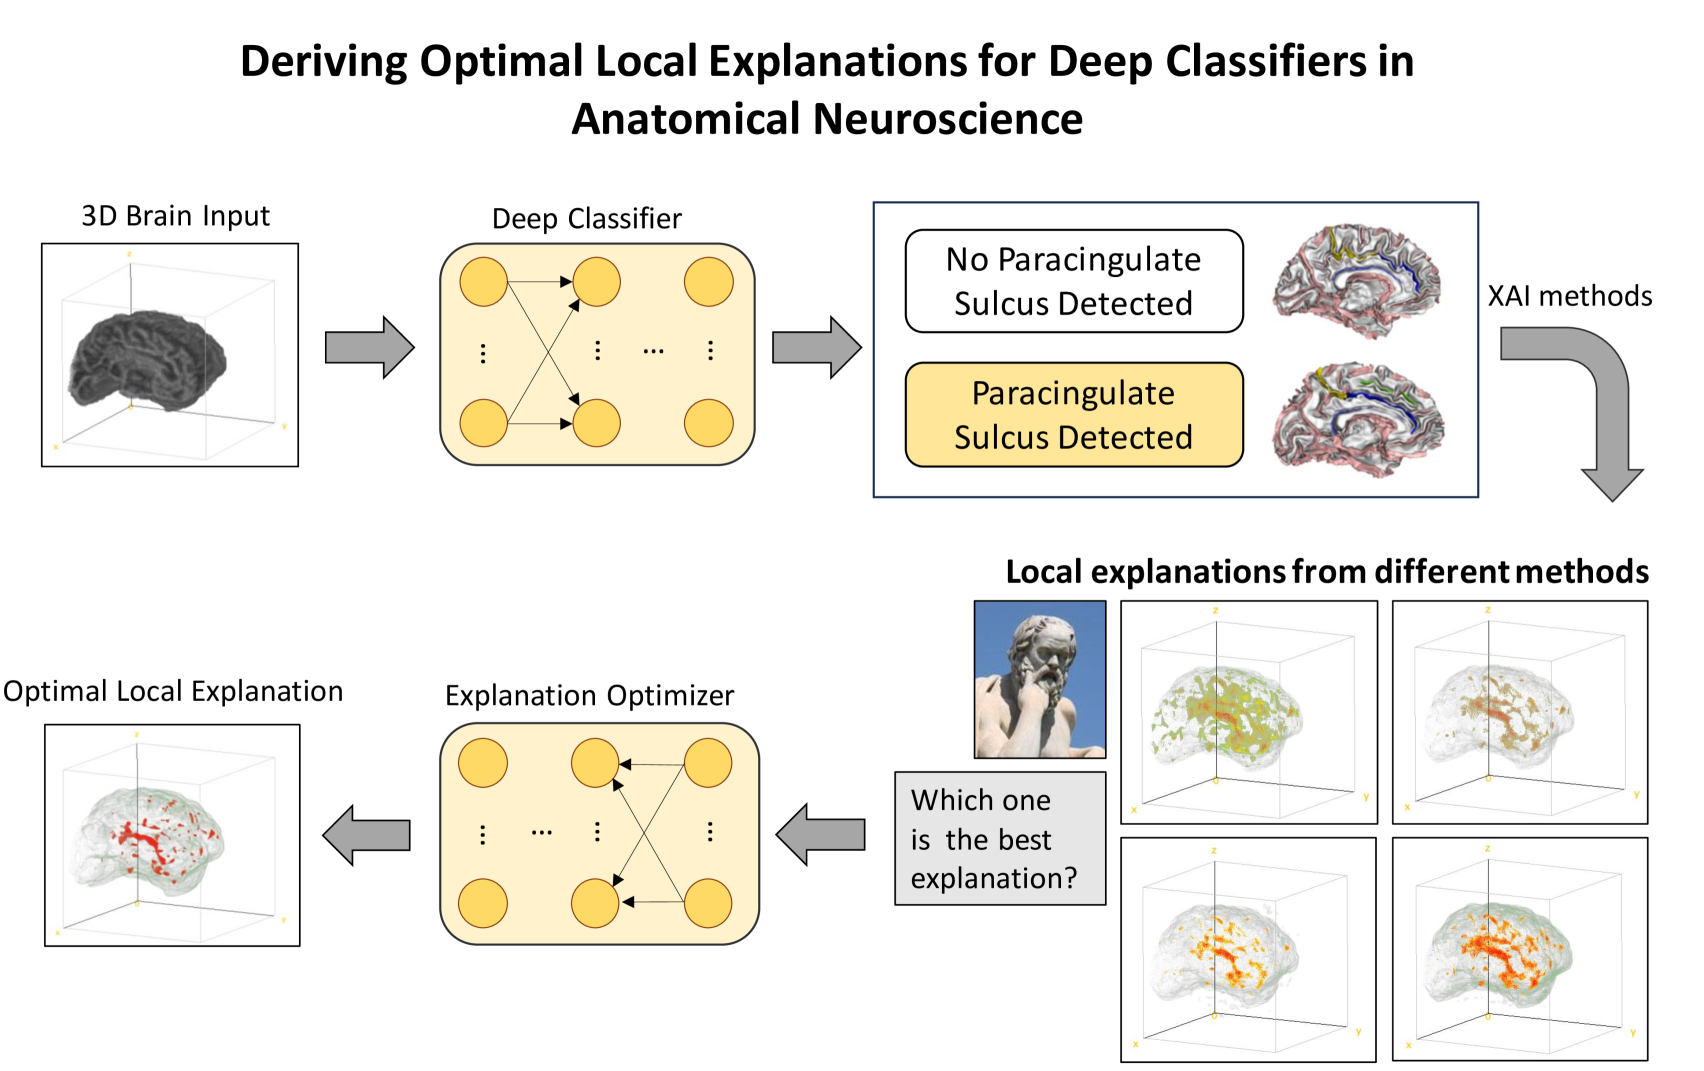
Solving the enigma: Deriving optimal explanations of deep networks
Michail Mamalakis, Antonios Mamalakis, Ingrid Agartz, Lynn Egeland M{o}rch-Johnsen, Graham Murray, John Suckling, Pietro Lio
The accelerated progress of artificial intelligence (AI) has popularized deep learning models across domains, yet their inherent opacity poses challenges, notably in critical fields like healthcare, medicine and the geosciences. Explainable AI (XAI) has emerged to shed light on these black box models, helping decipher their decision making process. Nevertheless, different XAI methods yield highly different explanations. This inter-method variability increases uncertainty and lowers trust in deep networks' predictions. In this study, for the first time, we propose a novel framework designed to enhance the explainability of deep networks, by maximizing both the accuracy and the comprehensibility of the explanations. Our framework integrates various explanations from established XAI methods and employs a non-linear explanation optimizer to construct a unique and optimal explanation. Through experiments on multi-class and binary classification tasks in 2D object and 3D neuroscience imaging, we validate the efficacy of our approach. Our explanation optimizer achieved superior faithfulness scores, averaging 155% and 63% higher than the best performing XAI method in the 3D and 2D applications, respectively. Additionally, our approach yielded lower complexity, increasing comprehensibility. Our results suggest that optimal explanations based on specific criteria are derivable and address the issue of inter-method variability in the current XAI literature.
Read more5/17/2024