A Literature-based Visualization Task Taxonomy for Gantt Charts

0
Sign in to get full access
Overview
- This research paper proposes a taxonomy of visualization tasks for Gantt charts, a common type of project management visualization.
- The taxonomy is developed based on a literature review of prior work on visualization tasks and Gantt chart usage.
- The goal is to provide a framework for understanding the different ways users might interact with and analyze Gantt chart data.
Plain English Explanation
Gantt charts are a popular way to visualize project schedules and timelines. They show tasks, their durations, and how they relate to one another over time. This paper looks at the different things people might want to do when working with Gantt charts, like understanding the overall project progress, comparing task durations, or identifying dependencies between tasks.
The researchers reviewed existing research on visualization tasks and how people use Gantt charts. From this, they developed a taxonomy - a way of categorizing and organizing the different types of tasks people might perform. This taxonomy can help designers of Gantt chart software and other visualization tools understand the diverse needs and goals users might have.
Technical Explanation
The paper first reviews prior work on visualization task taxonomies and the use of Gantt charts. It then presents a new taxonomy of Gantt chart visualization tasks, organized into three main categories:
-
Temporal Tasks: These involve analyzing the timing and duration of tasks, such as understanding the overall project timeline, comparing task start/end times, and identifying task dependencies.
-
Attribute Tasks: These focus on understanding the properties of individual tasks, like their status, resources, or constraints.
-
Relational Tasks: These examine how tasks are connected and relate to one another, such as identifying critical paths or comparing task allocations across team members.
For each task type, the taxonomy describes the underlying data queries and visual interactions needed to support them. This provides a comprehensive framework for designing effective Gantt chart visualizations and interactions.
Critical Analysis
The taxonomy presented in this paper provides a useful conceptual model for understanding the diverse needs and goals of Gantt chart users. By grounding the taxonomy in prior literature, the authors have developed a robust framework that can inform the design of Gantt chart visualization tools.
One potential limitation is that the taxonomy may not capture all possible Gantt chart usage scenarios, as user needs can vary widely across different application domains and organizational contexts. Additionally, the taxonomy focuses on individual user tasks, but doesn't address higher-level collaborative or decision-making processes that may involve Gantt charts.
Further research could explore how this taxonomy interacts with other frameworks for visualization tasks and how it applies in real-world project management settings. Empirical studies validating the taxonomy's completeness and usefulness would also strengthen the work.
Conclusion
This paper makes an important contribution by developing a comprehensive taxonomy of visualization tasks for Gantt charts. This framework can help visualization designers better understand user needs and develop more effective tools for project planning and management. By grounding the taxonomy in prior literature, the authors have provided a solid foundation for future research and application of Gantt chart visualization techniques.
This summary was produced with help from an AI and may contain inaccuracies - check out the links to read the original source documents!
Related Papers
0
A Literature-based Visualization Task Taxonomy for Gantt Charts
Sayef Azad Sakin, Katherine E. Isaacs
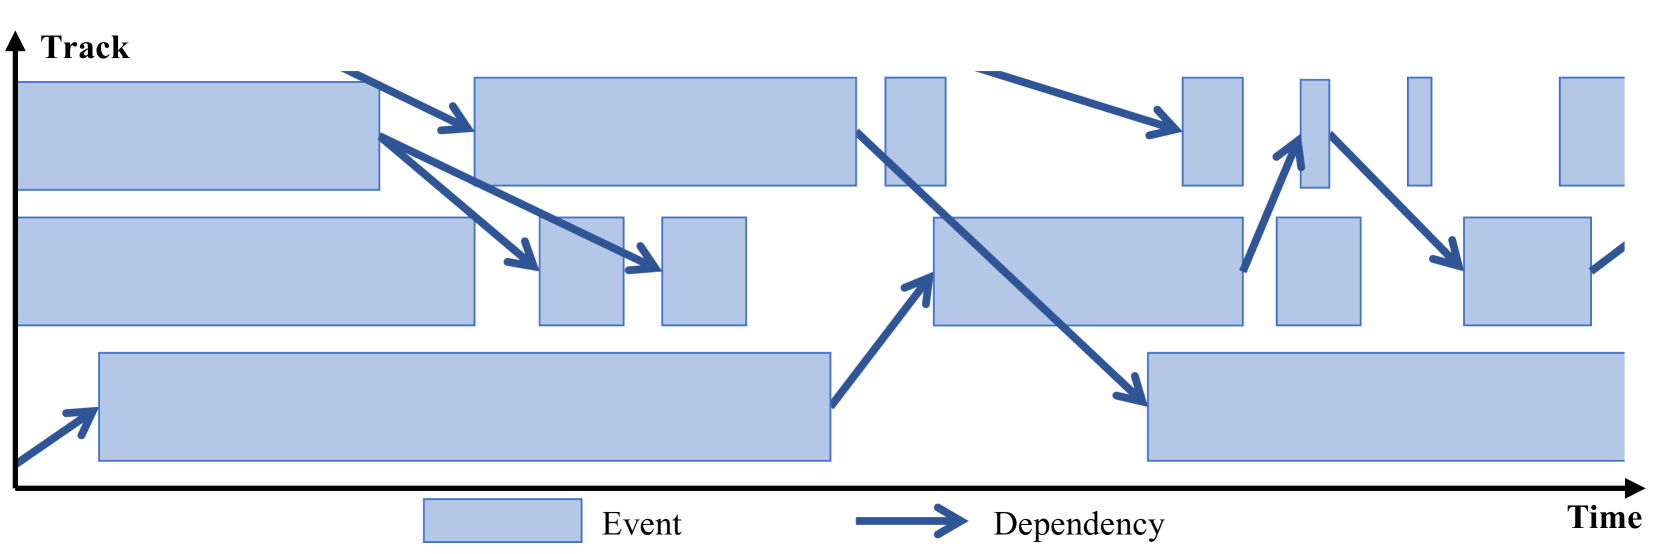
Gantt charts are a widely-used idiom for visualizing temporal discrete event sequence data where dependencies exist between events. They are popular in domains such as manufacturing and computing for their intuitive layout of such data. However, these domains frequently generate data at scales which tax both the visual representation and the ability to render it at interactive speeds. To aid visualization developers who use Gantt charts in these situations, we develop a task taxonomy of low level visualization tasks supported by Gantt charts and connect them to the data queries needed to support them. Our taxonomy is derived through a literature survey of visualizations using Gantt charts over the past 30 years.
Read more8/22/2024

0
A Typology of Decision-Making Tasks for Visualization
Camelia D. Brumar, Sam Molnar, Gabriel Appleby, Kristi Potter, Remco Chang
Despite decision-making being a vital goal of data visualization, little work has been done to differentiate the decision-making tasks within our field. While visualization task taxonomies and typologies exist, they are often too granular for describing complex decision goals and decision-making processes, thus limiting their potential use in designing decision-support tools. In this paper, we contribute a typology of decision-making tasks that were iteratively refined from a list of design goals distilled from a literature review. Our typology is concise and consists of only three tasks: choose, activate, and create. Originally proposed by the scientific community, we extend and provide definitions for these tasks that are suitable for the visualization community. Our proposed typology offers two benefits. First, it facilitates the composition of decisions using these three tasks, allowing for flexible and clear descriptions across varying complexities and domains. Second, diagrams created using this typology encourage productive discourse between visualization designers and domain experts by abstracting the intricacies of data, thereby promoting clarity and rigorous analysis of decision-making processes. We motivate the use of our typology through four case studies and demonstrate the benefits of our approach through semi-structured interviews conducted with experienced members of the visualization community, comprising academic and industry experts, who have contributed to developing or publishing decision support systems for domain experts. Our interviewees composed diagrams using our typology to delineate the decision-making processes that drive their decision-support tools, demonstrating its descriptive capacity and effectiveness.
Read more4/23/2024

0
Intents, Techniques, and Components: a Unified Analysis of Interaction Authoring Tasks in Data Visualization
Hyemi Song, Sai Gopinath, Zhicheng Liu
There is a growing interest in designing tools to support interactivity specification and authoring in data visualization. To develop expressive and flexible tools, we need theories and models that describe the task space of interaction authoring. Although multiple taxonomies and frameworks exist for interactive visualization, they primarily focus on how visualizations are used, not how interactivity is composed. To fill this gap, we conduct an analysis of 592 interaction units from 47 real-world visualization applications. Based on the analysis, we present a unified analysis of interaction authoring tasks across three levels of description: intents, representative techniques, and low-level implementation components. We examine our framework's descriptive, evaluative, and generative powers for critiquing existing interactivity authoring tools and informing new tool development.
Read more9/4/2024

0
A Multi-Level Task Framework for Event Sequence Analysis
Kazi Tasnim Zinat, Saimadhav Naga Sakhamuri, Aaron Sun Chen, Zhicheng Liu
Despite the development of numerous visual analytics tools for event sequence data across various domains, including but not limited to healthcare, digital marketing, and user behavior analysis, comparing these domain-specific investigations and transferring the results to new datasets and problem areas remain challenging. Task abstractions can help us go beyond domain-specific details, but existing visualization task abstractions are insufficient for event sequence visual analytics because they primarily focus on multivariate datasets and often overlook automated analytical techniques. To address this gap, we propose a domain-agnostic multi-level task framework for event sequence analytics, derived from an analysis of 58 papers that present event sequence visualization systems. Our framework consists of four levels: objective, intent, strategy, and technique. Overall objectives identify the main goals of analysis. Intents comprises five high-level approaches adopted at each analysis step: augment data, simplify data, configure data, configure visualization, and manage provenance. Each intent is accomplished through a number of strategies, for instance, data simplification can be achieved through aggregation, summarization, or segmentation. Finally, each strategy can be implemented by a set of techniques depending on the input and output components. We further show that each technique can be expressed through a quartet of action-input-output-criteria. We demonstrate the framework's descriptive power through case studies and discuss its similarities and differences with previous event sequence task taxonomies.
Read more8/12/2024