Multiclass ROC

0
Sign in to get full access
Overview
- This paper discusses the limitations of common performance metrics used for evaluating machine learning models, particularly in the context of imbalanced classification problems.
- The authors propose a novel visualization technique called the "Multiclass ROC" (Receiver Operating Characteristic) curve, which provides a more comprehensive assessment of model performance across multiple classes.
- The paper also explores the relationship between various performance metrics, such as AUROC, AUPRC, and accuracy, and highlights the potential pitfalls of relying on a single metric for model evaluation.
Plain English Explanation
In machine learning, we often use various metrics to evaluate the performance of our models. However, these metrics can sometimes be misleading, especially when dealing with imbalanced datasets, where some classes have many more examples than others.
The Multiclass ROC curve proposed in this paper is a visual tool that can help us better understand how well a model is performing across different classes. It shows the trade-offs between the true positive rate and the false positive rate for each class, allowing us to see where the model is struggling and where it's performing well.
This is important because commonly used metrics like AUROC and AUPRC can sometimes give us a distorted view of a model's performance, particularly when the classes are imbalanced. The Multiclass ROC curve helps us identify these issues and make more informed decisions about model selection and optimization.
By understanding the strengths and limitations of different performance metrics, we can fix the right problems and develop more robust and reliable machine learning models. This is particularly important in applications where the consequences of misclassification can be severe, such as in healthcare or finance.
Technical Explanation
The paper introduces the Multiclass ROC curve as a way to visualize the performance of a multi-class classification model. Unlike traditional ROC curves, which are designed for binary classification, the Multiclass ROC curve extends the concept to handle multiple classes.
The key idea is to plot the true positive rate (TPR) against the false positive rate (FPR) for each class, resulting in a set of ROC curves. This allows the user to assess the model's performance across all classes, rather than just focusing on a single metric like AUROC.
The authors also discuss the relationship between various performance metrics, such as AUROC, AUPRC, and accuracy. They demonstrate that these metrics can sometimes give contradictory results, particularly in the presence of class imbalance, highlighting the need for a more holistic approach to model evaluation.
The paper also discusses the concept of Schrodinger's threshold, where a model can have high AUROC but low accuracy, and argues that the Multiclass ROC curve can help identify such cases.
Critical Analysis
The Multiclass ROC curve proposed in this paper is a valuable addition to the toolbox of machine learning practitioners, particularly those working on imbalanced classification problems. By providing a more comprehensive view of model performance, it can help researchers and practitioners make more informed decisions about model selection and optimization.
One potential limitation of the Multiclass ROC curve is that it can become unwieldy to interpret as the number of classes increases. The authors acknowledge this and suggest that the "$F_\beta$-plot", a related visualization technique, may be more suitable for datasets with a large number of classes.
Additionally, the paper does not provide guidance on how to use the Multiclass ROC curve to directly optimize model performance. While it can help identify areas for improvement, the paper does not discuss specific techniques for model tuning or architecture selection based on the insights gained from the Multiclass ROC curve.
Overall, this paper provides a valuable contribution to the field of machine learning by highlighting the limitations of common performance metrics and proposing a novel visualization technique to address these shortcomings. By encouraging a more holistic approach to model evaluation, the authors hope to fix the right problems and develop more robust and reliable machine learning models.
Conclusion
This paper introduces the Multiclass ROC curve, a novel visualization technique that provides a more comprehensive assessment of machine learning model performance in the context of imbalanced classification problems. By highlighting the limitations of commonly used metrics like AUROC and AUPRC, the authors encourage a more nuanced approach to model evaluation and optimization.
The Multiclass ROC curve can help researchers and practitioners identify areas where their models are struggling, allowing them to fix the right problems and develop more reliable machine learning systems. This is particularly important in high-stakes applications, where the consequences of misclassification can be severe.
Overall, this paper makes a valuable contribution to the field of machine learning by challenging the assumptions underlying common performance metrics and providing a new tool to help researchers and practitioners navigate the complexities of imbalanced classification problems.
This summary was produced with help from an AI and may contain inaccuracies - check out the links to read the original source documents!
Related Papers
0
Multiclass ROC
Liang Wang, Luis Carvalho
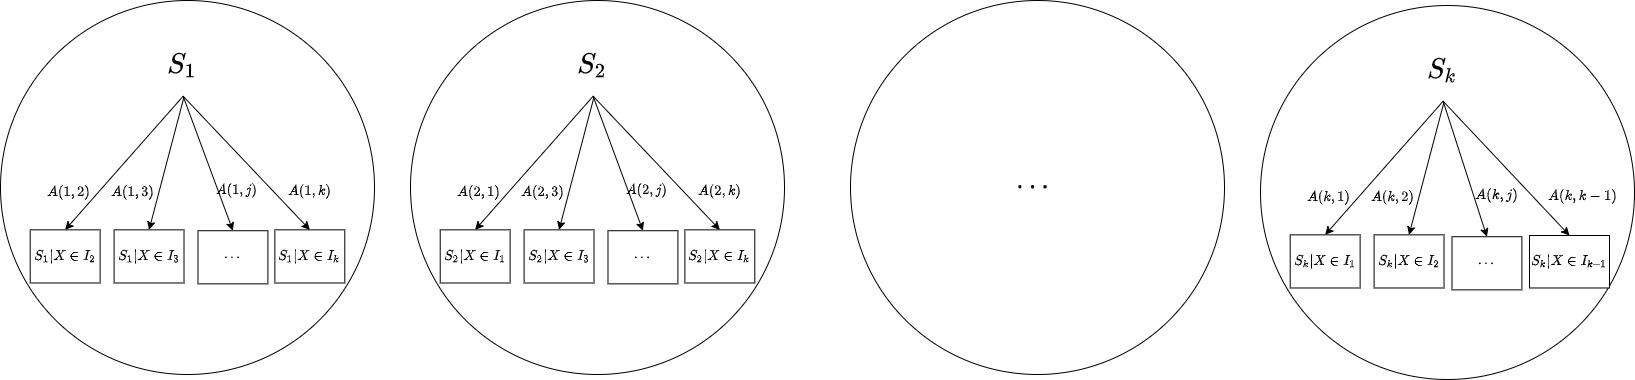
Model evaluation is of crucial importance in modern statistics application. The construction of ROC and calculation of AUC have been widely used for binary classification evaluation. Recent research generalizing the ROC/AUC analysis to multi-class classification has problems in at least one of the four areas: 1. failure to provide sensible plots 2. being sensitive to imbalanced data 3. unable to specify mis-classification cost and 4. unable to provide evaluation uncertainty quantification. Borrowing from a binomial matrix factorization model, we provide an evaluation metric summarizing the pair-wise multi-class True Positive Rate (TPR) and False Positive Rate (FPR) with one-dimensional vector representation. Visualization on the representation vector measures the relative speed of increment between TPR and FPR across all the classes pairs, which in turns provides a ROC plot for the multi-class counterpart. An integration over those factorized vector provides a binary AUC-equivalent summary on the classifier performance. Mis-clasification weights specification and bootstrapped confidence interval are also enabled to accommodate a variety of of evaluation criteria. To support our findings, we conducted extensive simulation studies and compared our method to the pair-wise averaged AUC statistics on benchmark datasets.
Read more4/23/2024

0
Area under the ROC Curve has the Most Consistent Evaluation for Binary Classification
Jing Li
Evaluation Metrics is an important question for model evaluation and model selection in binary classification tasks. This study investigates how consistent metrics are at evaluating different models under different data scenarios. Analyzing over 150 data scenarios and 18 model evaluation metrics using statistical simulation, I find that for binary classification tasks, evaluation metrics that are less influenced by prevalence offer more consistent ranking of a set of different models. In particular, Area Under the ROC Curve (AUC) has smallest variance in ranking of different models. Matthew's correlation coefficient as a more strict measure of model performance has the second smallest variance. These patterns holds across a rich set of data scenarios and five commonly used machine learning models as well as a naive random guess model. The results have significant implications for model evaluation and model selection in binary classification tasks.
Read more8/20/2024

0
Overcoming Common Flaws in the Evaluation of Selective Classification Systems
Jeremias Traub, Till J. Bungert, Carsten T. Luth, Michael Baumgartner, Klaus H. Maier-Hein, Lena Maier-Hein, Paul F Jaeger
Selective Classification, wherein models can reject low-confidence predictions, promises reliable translation of machine-learning based classification systems to real-world scenarios such as clinical diagnostics. While current evaluation of these systems typically assumes fixed working points based on pre-defined rejection thresholds, methodological progress requires benchmarking the general performance of systems akin to the $mathrm{AUROC}$ in standard classification. In this work, we define 5 requirements for multi-threshold metrics in selective classification regarding task alignment, interpretability, and flexibility, and show how current approaches fail to meet them. We propose the Area under the Generalized Risk Coverage curve ($mathrm{AUGRC}$), which meets all requirements and can be directly interpreted as the average risk of undetected failures. We empirically demonstrate the relevance of $mathrm{AUGRC}$ on a comprehensive benchmark spanning 6 data sets and 13 confidence scoring functions. We find that the proposed metric substantially changes metric rankings on 5 out of the 6 data sets.
Read more7/2/2024
🚀
0
Robust performance metrics for imbalanced classification problems
Hajo Holzmann, Bernhard Klar
We show that established performance metrics in binary classification, such as the F-score, the Jaccard similarity coefficient or Matthews' correlation coefficient (MCC), are not robust to class imbalance in the sense that if the proportion of the minority class tends to $0$, the true positive rate (TPR) of the Bayes classifier under these metrics tends to $0$ as well. Thus, in imbalanced classification problems, these metrics favour classifiers which ignore the minority class. To alleviate this issue we introduce robust modifications of the F-score and the MCC for which, even in strongly imbalanced settings, the TPR is bounded away from $0$. We numerically illustrate the behaviour of the various performance metrics in simulations as well as on a credit default data set. We also discuss connections to the ROC and precision-recall curves and give recommendations on how to combine their usage with performance metrics.
Read more4/12/2024