Normalized Stress is Not Normalized: How to Interpret Stress Correctly

0
Sign in to get full access
Overview
- Stress is a widely used metric in various fields, but its interpretation can be challenging.
- This paper examines the issues with the commonly used "normalized stress" metric and provides guidance on how to interpret stress correctly.
Plain English Explanation
The paper discusses the concept of "normalized stress," which is a metric used to measure the quality of multidimensional projections. Normalized stress is intended to provide a standardized way to compare the performance of different projection methods. However, the authors argue that this metric is often misinterpreted, leading to incorrect conclusions about the quality of the projections.
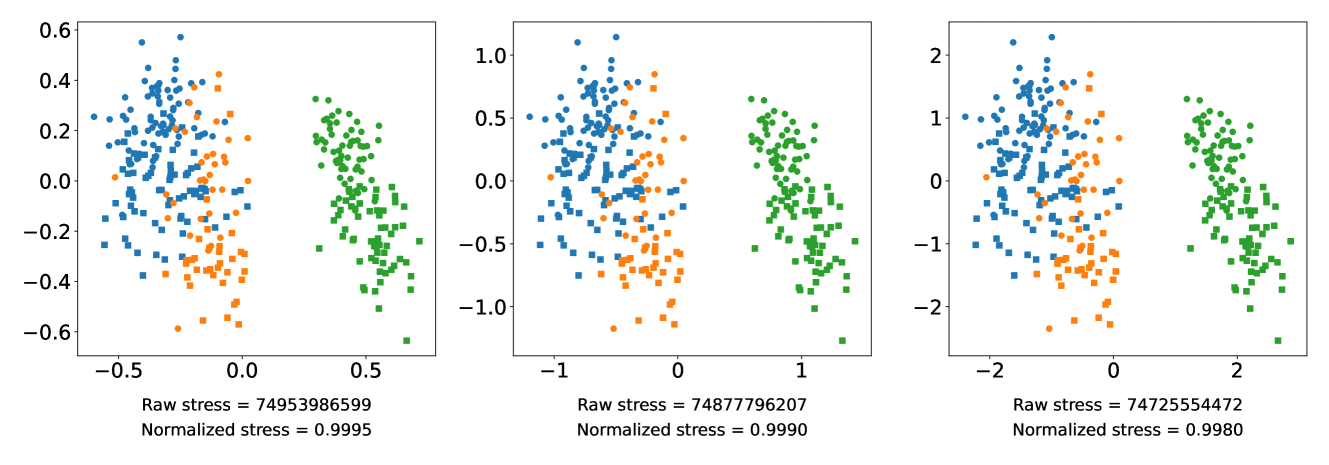
The key issue is that normalized stress is not truly "normalized" in the sense of being bounded between 0 and 1. Instead, it can take on values greater than 1, which can be counterintuitive and lead to misunderstandings. The authors provide clear guidance on how to correctly interpret stress values, including the importance of considering the range of possible stress values for a given dataset and projection method.
By understanding the limitations of normalized stress and using more appropriate metrics, researchers and practitioners can make more informed decisions about the quality of their multidimensional projections and draw more reliable conclusions from their analyses.
Technical Explanation
The paper begins by defining the key concepts of stress and normalized stress. Stress is a measure of how well the pairwise distances between data points in a high-dimensional space are preserved in a lower-dimensional projection. Normalized stress is a variant of this metric that is intended to provide a standardized scale for comparison.
However, the authors demonstrate that normalized stress is not truly normalized, as it can take on values greater than 1. This is because the possible range of stress values depends on the specific dataset and projection method being used. The authors provide a mathematical formula to calculate the maximum possible stress value for a given scenario, which can be used to interpret stress values correctly.
The paper also discusses the implications of this issue for evaluating the performance of different projection methods. The authors emphasize the importance of considering the range of possible stress values, rather than relying solely on the normalized stress metric.
Critical Analysis
The authors acknowledge that the issue of normalized stress being misinterpreted is not new, but they provide a clear and comprehensive analysis of the problem, as well as practical guidance on how to address it. The mathematical formulation of the maximum possible stress value is a valuable contribution, as it gives researchers a tool to better understand and interpret the stress metric.
One potential limitation of the research is that it focuses primarily on the stress metric and does not explore other quality metrics for evaluating multidimensional projections. While stress is a widely used metric, there may be cases where other metrics are more appropriate or informative.
Additionally, the paper does not delve into the specific implications of misinterpreting stress for different application domains or research areas. It would be interesting to see how the authors' insights could be applied to and inform the interpretation of stress in various contexts, such as data visualization, dimensionality reduction, or machine learning.
Conclusion
This paper highlights an important issue in the interpretation of the commonly used "normalized stress" metric, which can lead to misunderstandings and incorrect conclusions about the quality of multidimensional projections. By providing a clear mathematical framework for understanding the range of possible stress values and guidance on how to interpret stress correctly, the authors contribute valuable insights that can help researchers and practitioners make more informed decisions and draw more reliable conclusions from their analyses.
This summary was produced with help from an AI and may contain inaccuracies - check out the links to read the original source documents!
Related Papers
0
Normalized Stress is Not Normalized: How to Interpret Stress Correctly
Kiran Smelser, Jacob Miller, Stephen Kobourov
Stress is among the most commonly employed quality metrics and optimization criteria for dimension reduction projections of high dimensional data. Complex, high dimensional data is ubiquitous across many scientific disciplines, including machine learning, biology, and the social sciences. One of the primary methods of visualizing these datasets is with two dimensional scatter plots that visually capture some properties of the data. Because visually determining the accuracy of these plots is challenging, researchers often use quality metrics to measure projection accuracy or faithfulness to the full data. One of the most commonly employed metrics, normalized stress, is sensitive to uniform scaling of the projection, despite this act not meaningfully changing anything about the projection. We investigate the effect of scaling on stress and other distance based quality metrics analytically and empirically by showing just how much the values change and how this affects dimension reduction technique evaluations. We introduce a simple technique to make normalized stress scale invariant and show that it accurately captures expected behavior on a small benchmark.
Read more8/16/2024
0
The Perception of Stress in Graph Drawings
Gavin J. Mooney, Helen C. Purchase, Michael Wybrow, Stephen G. Kobourov, Jacob Miller
Most of the common graph layout principles (a.k.a. aesthetics) on which many graph drawing algorithms are based are easy to define and to perceive. For example, the number of pairs of edges that cross each other, how symmetric a drawing looks, the aspect ratio of the bounding box, or the angular resolution at the nodes. The extent to which a graph drawing conforms to these principles can be determined by looking at how it is drawn -- that is, by looking at the marks on the page -- without consideration for the underlying structure of the graph. A key layout principle is that of optimising `stress', the basis for many algorithms such as the popular Kamada & Kawai algorithm and several force-directed algorithms. The stress of a graph drawing is, loosely speaking, the extent to which the geometric distance between each pair of nodes is proportional to the shortest path between them -- over the whole graph drawing. The definition of stress therefore relies on the underlying structure of the graph (the `paths') in a way that other layout principles do not, making stress difficult to describe to novices unfamiliar with graph drawing principles, and, we believe, difficult to perceive. We conducted an experiment to see whether people (novices as well as experts) can see stress in graph drawings, and found that it is possible to train novices to `see' stress -- even if their perception strategies are not based on the definitional concepts.
Read more9/24/2024

0
Improving multidimensional projection quality with user-specific metrics and optimal scaling
Maniru Ibrahim
The growing prevalence of high-dimensional data has fostered the development of multidimensional projection (MP) techniques, such as t-SNE, UMAP, and LAMP, for data visualization and exploration. However, conventional MP methods typically employ generic quality metrics, neglecting individual user preferences. This study proposes a new framework that tailors MP techniques based on user-specific quality criteria, enhancing projection interpretability. Our approach combines three visual quality metrics, stress, neighborhood preservation, and silhouette score, to create a composite metric for a precise MP evaluation. We then optimize the projection scale by maximizing the composite metric value. We conducted an experiment involving two users with different projection preferences, generating projections using t-SNE, UMAP, and LAMP. Users rate projections according to their criteria, producing two training sets. We derive optimal weights for each set and apply them to other datasets to determine the best projections per user. Our findings demonstrate that personalized projections effectively capture user preferences, fostering better data exploration and enabling more informed decision-making. This user-centric approach promotes advancements in multidimensional projection techniques that accommodate diverse user preferences and enhance interpretability.
Read more7/24/2024

0
Stressor Type Matters! -- Exploring Factors Influencing Cross-Dataset Generalizability of Physiological Stress Detection
Pooja Prajod, Bhargavi Mahesh, Elisabeth Andr'e
Automatic stress detection using heart rate variability (HRV) features has gained significant traction as it utilizes unobtrusive wearable sensors measuring signals like electrocardiogram (ECG) or blood volume pulse (BVP). However, detecting stress through such physiological signals presents a considerable challenge owing to the variations in recorded signals influenced by factors, such as perceived stress intensity and measurement devices. Consequently, stress detection models developed on one dataset may perform poorly on unseen data collected under different conditions. To address this challenge, this study explores the generalizability of machine learning models trained on HRV features for binary stress detection. Our goal extends beyond evaluating generalization performance; we aim to identify the characteristics of datasets that have the most significant influence on generalizability. We leverage four publicly available stress datasets (WESAD, SWELL-KW, ForDigitStress, VerBIO) that vary in at least one of the characteristics such as stress elicitation techniques, stress intensity, and sensor devices. Employing a cross-dataset evaluation approach, we explore which of these characteristics strongly influence model generalizability. Our findings reveal a crucial factor affecting model generalizability: stressor type. Models achieved good performance across datasets when the type of stressor (e.g., social stress in our case) remains consistent. Factors like stress intensity or brand of the measurement device had minimal impact on cross-dataset performance. Based on our findings, we recommend matching the stressor type when deploying HRV-based stress models in new environments. To the best of our knowledge, this is the first study to systematically investigate factors influencing the cross-dataset applicability of HRV-based stress models.
Read more5/17/2024