FlowLearn: Evaluating Large Vision-Language Models on Flowchart Understanding

0
Sign in to get full access
Overview
• This paper, titled "FlowLearn: Evaluating Large Vision-Language Models on Flowchart Understanding," examines how well large vision-language models perform on the task of understanding and interpreting flowcharts.
• The researchers evaluate the capabilities of several prominent vision-language models, including CLIP, VinVL, and ChartBERT, on a newly introduced dataset called FlowLearn.
• The FlowLearn dataset contains a diverse collection of flowcharts covering various domains, along with associated textual descriptions and annotations, providing a comprehensive benchmark for evaluating flowchart understanding.
Plain English Explanation
The paper explores how well large vision-language models, which are trained on a vast amount of visual and textual data, can understand and interpret flowcharts. Flowcharts are visual diagrams that depict step-by-step processes, and they are commonly used in fields like computer science, business, and engineering.
The researchers created a new dataset called FlowLearn, which contains a wide range of flowcharts from different domains, along with textual descriptions and annotations. They then tested several prominent vision-language models, such as CLIP, VinVL, and ChartBERT, on this dataset to see how well they could comprehend and reason about the flowcharts.
The results provide insights into the current capabilities and limitations of these large vision-language models when it comes to understanding complex visual information, such as flowcharts. This research can inform the development of more advanced models that can better handle such tasks, which could have practical applications in areas like automated process documentation, intelligent assistants, and educational technology.
Technical Explanation
The paper presents a comprehensive evaluation of large vision-language models on the task of flowchart understanding. The researchers introduce a new dataset called FlowLearn, which contains a diverse collection of flowcharts across various domains, along with associated textual descriptions and annotations.
To evaluate the performance of these models, the researchers conducted several experiments, including:
- Flowchart Comprehension: Assessing the models' ability to understand the overall structure and logic of flowcharts by answering questions about their content.
- Flowchart Element Identification: Evaluating the models' capacity to identify and classify the different elements (e.g., decision nodes, action steps) within a flowchart.
- Flowchart-to-Text Generation: Examining the models' ability to generate textual descriptions that accurately capture the key steps and logic of a given flowchart.
The researchers tested several prominent vision-language models, such as CLIP, VinVL, and ChartBERT, on the FlowLearn dataset. The results reveal that while these models demonstrate impressive performance on various visual understanding tasks, they still face challenges when it comes to the complex reasoning and comprehension required for flowchart understanding.
The findings highlight the need for further advancements in vision-language modeling to better handle the unique characteristics and requirements of flowchart understanding, which could have significant implications for applications such as automated process documentation, intelligent assistants, and educational technology.
Critical Analysis
The paper provides a thorough and well-designed evaluation of large vision-language models on the task of flowchart understanding. The researchers' introduction of the FlowLearn dataset is a valuable contribution, as it offers a comprehensive benchmark for assessing model performance on this specific task.
However, the paper also acknowledges some limitations of the study:
- Dataset Diversity: While the FlowLearn dataset covers a wide range of domains, there may still be some biases or gaps in the types of flowcharts represented, which could affect the generalizability of the results.
- Model Limitations: The paper highlights that the current generation of large vision-language models, while powerful, still struggle with the complex reasoning and comprehension required for flowchart understanding. Further research is needed to address these limitations.
- Real-World Applicability: The paper focuses on evaluating model performance on specific, controlled tasks. More research is needed to understand how these models would perform in real-world applications, where the complexity and contextual requirements may be even greater.
Additionally, it would be interesting to see future work explore the potential of more specialized or tailored approaches to flowchart understanding, such as incorporating domain-specific knowledge or leveraging additional modalities (e.g., structural information, animation) beyond just the static visual and textual components.
Conclusion
The paper "FlowLearn: Evaluating Large Vision-Language Models on Flowchart Understanding" presents a comprehensive evaluation of the capabilities of large vision-language models in comprehending and reasoning about flowcharts. The introduction of the FlowLearn dataset and the detailed experiments conducted provide valuable insights into the current state of the art and the challenges that still need to be addressed.
The findings suggest that while these models demonstrate impressive performance on various visual understanding tasks, they still face limitations when it comes to the complex reasoning and comprehension required for flowchart understanding. This research highlights the need for further advancements in vision-language modeling to better handle such specialized tasks, which could have significant implications for applications like automated process documentation, intelligent assistants, and educational technology.
Overall, this paper contributes to our understanding of the strengths and weaknesses of large vision-language models, and it sets the stage for future research to develop more robust and capable models for flowchart understanding and other complex visual-textual reasoning tasks.
This summary was produced with help from an AI and may contain inaccuracies - check out the links to read the original source documents!
Related Papers
0
FlowLearn: Evaluating Large Vision-Language Models on Flowchart Understanding
Huitong Pan, Qi Zhang, Cornelia Caragea, Eduard Dragut, Longin Jan Latecki
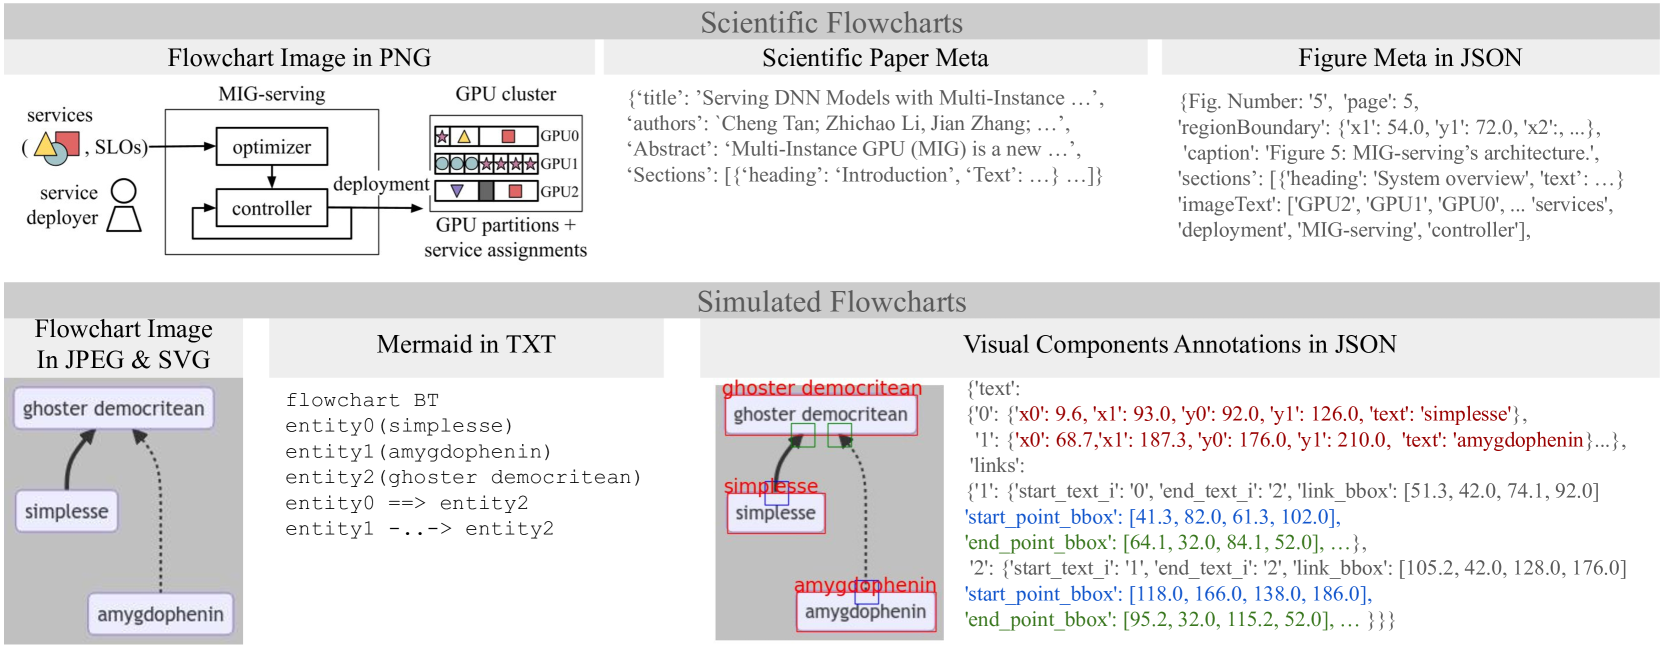
Flowcharts are graphical tools for representing complex concepts in concise visual representations. This paper introduces the FlowLearn dataset, a resource tailored to enhance the understanding of flowcharts. FlowLearn contains complex scientific flowcharts and simulated flowcharts. The scientific subset contains 3,858 flowcharts sourced from scientific literature and the simulated subset contains 10,000 flowcharts created using a customizable script. The dataset is enriched with annotations for visual components, OCR, Mermaid code representation, and VQA question-answer pairs. Despite the proven capabilities of Large Vision-Language Models (LVLMs) in various visual understanding tasks, their effectiveness in decoding flowcharts - a crucial element of scientific communication - has yet to be thoroughly investigated. The FlowLearn test set is crafted to assess the performance of LVLMs in flowchart comprehension. Our study thoroughly evaluates state-of-the-art LVLMs, identifying existing limitations and establishing a foundation for future enhancements in this relatively underexplored domain. For instance, in tasks involving simulated flowcharts, GPT-4V achieved the highest accuracy (58%) in counting the number of nodes, while Claude recorded the highest accuracy (83%) in OCR tasks. Notably, no single model excels in all tasks within the FlowLearn framework, highlighting significant opportunities for further development.
Read more7/11/2024
0
First Multi-Dimensional Evaluation of Flowchart Comprehension for Multimodal Large Language Models
Enming Zhang, Ruobing Yao, Huanyong Liu, Junhui Yu, Jiale Wang
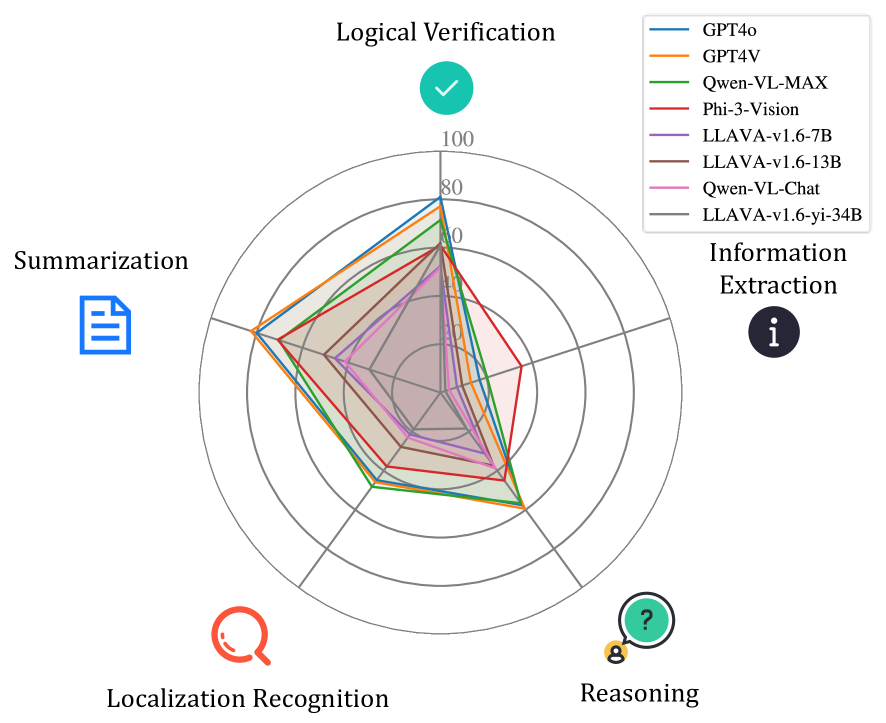
With the development of Multimodal Large Language Models (MLLMs) technology, its general capabilities are increasingly powerful. To evaluate the various abilities of MLLMs, numerous evaluation systems have emerged. But now there is still a lack of a comprehensive method to evaluate MLLMs in the tasks related to flowcharts, which are very important in daily life and work. We propose the first comprehensive method, FlowCE, to assess MLLMs across various dimensions for tasks related to flowcharts. It encompasses evaluating MLLMs' abilities in Reasoning, Localization Recognition, Information Extraction, Logical Verification, and Summarization on flowcharts. However, we find that even the GPT4o model achieves only a score of 56.63. Among open-source models, Phi-3-Vision obtained the highest score of 49.97. We hope that FlowCE can contribute to future research on MLLMs for tasks based on flowcharts. url{https://github.com/360AILAB-NLP/FlowCE} end{abstract}
Read more6/19/2024

0
FlowVQA: Mapping Multimodal Logic in Visual Question Answering with Flowcharts
Shubhankar Singh, Purvi Chaurasia, Yerram Varun, Pranshu Pandya, Vatsal Gupta, Vivek Gupta, Dan Roth
Existing benchmarks for visual question answering lack in visual grounding and complexity, particularly in evaluating spatial reasoning skills. We introduce FlowVQA, a novel benchmark aimed at assessing the capabilities of visual question-answering multimodal language models in reasoning with flowcharts as visual contexts. FlowVQA comprises 2,272 carefully generated and human-verified flowchart images from three distinct content sources, along with 22,413 diverse question-answer pairs, to test a spectrum of reasoning tasks, including information localization, decision-making, and logical progression. We conduct a thorough baseline evaluation on a suite of both open-source and proprietary multimodal language models using various strategies, followed by an analysis of directional bias. The results underscore the benchmark's potential as a vital tool for advancing the field of multimodal modeling, providing a focused and challenging environment for enhancing model performance in visual and logical reasoning tasks.
Read more7/1/2024
👀
0
Are Large Vision Language Models up to the Challenge of Chart Comprehension and Reasoning? An Extensive Investigation into the Capabilities and Limitations of LVLMs
Mohammed Saidul Islam, Raian Rahman, Ahmed Masry, Md Tahmid Rahman Laskar, Mir Tafseer Nayeem, Enamul Hoque
Natural language is a powerful complementary modality of communication for data visualizations, such as bar and line charts. To facilitate chart-based reasoning using natural language, various downstream tasks have been introduced recently such as chart question answering, chart summarization, and fact-checking with charts. These tasks pose a unique challenge, demanding both vision-language reasoning and a nuanced understanding of chart data tables, visual encodings, and natural language prompts. Despite the recent success of Large Language Models (LLMs) across diverse NLP tasks, their abilities and limitations in the realm of data visualization remain under-explored, possibly due to their lack of multi-modal capabilities. To bridge the gap, this paper presents the first comprehensive evaluation of the recently developed large vision language models (LVLMs) for chart understanding and reasoning tasks. Our evaluation includes a comprehensive assessment of LVLMs, including GPT-4V and Gemini, across four major chart reasoning tasks. Furthermore, we perform a qualitative evaluation of LVLMs' performance on a diverse range of charts, aiming to provide a thorough analysis of their strengths and weaknesses. Our findings reveal that LVLMs demonstrate impressive abilities in generating fluent texts covering high-level data insights while also encountering common problems like hallucinations, factual errors, and data bias. We highlight the key strengths and limitations of chart comprehension tasks, offering insights for future research.
Read more6/4/2024