Tracking the industrial growth of modern China with high-resolution panchromatic imagery: A sequential convolutional approach
2301.09620
0
0
📶
Abstract
Due to insufficient or difficult to obtain data on development in inaccessible regions, remote sensing data is an important tool for interested stakeholders to collect information on economic growth. To date, no studies have utilized deep learning to estimate industrial growth at the level of individual sites. In this study, we harness high-resolution panchromatic imagery to estimate development over time at 419 industrial sites in the People's Republic of China using a multi-tier computer vision framework. We present two methods for approximating development: (1) structural area coverage estimated through a Mask R-CNN segmentation algorithm, and (2) imputing development directly with visible & infrared radiance from the Visible Infrared Imaging Radiometer Suite (VIIRS). Labels generated from these methods are comparatively evaluated and tested. On a dataset of 2,078 50 cm resolution images spanning 19 years, the results indicate that two dimensions of industrial development can be estimated using high-resolution daytime imagery, including (a) the total square meters of industrial development (average error of 0.021 $textrm{km}^2$), and (b) the radiance of lights (average error of 9.8 $mathrm{frac{nW}{cm^{2}sr}}$). Trend analysis of the techniques reveal estimates from a Mask R-CNN-labeled CNN-LSTM track ground truth measurements most closely. The Mask R-CNN estimates positive growth at every site from the oldest image to the most recent, with an average change of 4,084 $textrm{m}^2$.
Create account to get full access
Overview
- This paper explores the use of deep learning and high-resolution satellite imagery to estimate industrial development over time at individual sites in China.
- The researchers present two methods to approximate development: (1) measuring structural area coverage using a Mask R-CNN segmentation algorithm, and (2) estimating radiance from the Visible Infrared Imaging Radiometer Suite (VIIRS).
- The results indicate these techniques can accurately track industrial growth, with the Mask R-CNN method showing the closest alignment to ground truth measurements.
Plain English Explanation
Tracking economic growth and development in hard-to-access regions can be challenging due to limited data. However, remote sensing data can provide a valuable window into these areas. In this study, the researchers leveraged high-resolution satellite imagery and deep learning to estimate industrial growth at over 400 individual sites in China.
The team explored two different approaches. First, they used a computer vision technique called Mask R-CNN to segment and measure the total structural area of industrial development at each site. This allowed them to quantify the physical footprint of growth over time. Second, they looked at the radiance, or brightness, of lights visible in the imagery, which can serve as a proxy for economic activity and development (similar to how nighttime light data has been used in the past).
By testing these methods against ground truth data, the researchers found they could track industrial growth quite accurately. The Mask R-CNN approach, in particular, showed the closest alignment, detecting positive growth at every site with an average increase of over 4,000 square meters. This demonstrates the potential of using advanced computer vision and remote sensing to overcome data gaps and gain insights into economic development in hard-to-reach regions.
Technical Explanation
The researchers utilized a multi-tier computer vision framework to estimate industrial development over time at 419 sites in China. They explored two primary techniques:
-
Structural Area Coverage Estimation: A Mask R-CNN segmentation algorithm was used to delineate and measure the total square meters of industrial structures in high-resolution panchromatic satellite imagery. This provided a direct quantification of the physical footprint of development.
-
Radiance Estimation: The team also looked at visible and infrared radiance data from the VIIRS sensor, using this as a proxy for economic activity and growth. They trained a model to impute development levels directly from the radiance measurements.
The researchers tested these methods on a dataset of 2,078 satellite images spanning 19 years. The results showed that both techniques could accurately estimate industrial growth, with the Mask R-CNN approach aligning most closely to ground truth measurements. The Mask R-CNN estimates indicated positive growth at every site, with an average increase of 4,084 square meters.
Critical Analysis
The researchers acknowledge several limitations in their study. First, the dataset was relatively small, focusing only on 419 sites in China. Expanding the geographical and sectoral scope of the analysis could help validate the generalizability of the findings.
Additionally, while the Mask R-CNN method proved effective, it relies on high-resolution imagery that may not be available or affordable in all contexts. The radiance-based approach offers an alternative that could be applied more broadly, but its accuracy may be more variable. Further research is needed to understand the tradeoffs between these techniques and how they perform in different environments.
It's also worth noting that both methods provide indirect measures of development, based on physical footprint or energy use. Integrating these remote sensing insights with other data sources, such as economic surveys or ground-based sensors, could lead to more holistic and accurate assessments of industrial growth and productivity.
Conclusion
This study demonstrates the potential of deep learning and high-resolution satellite imagery to overcome data gaps and gain insights into economic development, even in hard-to-access regions. By estimating industrial growth at the site level, the researchers have shown that these techniques can provide valuable, granular measurements to interested stakeholders.
While further research is needed to refine and expand the methods, this work highlights an exciting new frontier in using computer vision and remote sensing to track economic progress, with implications for urban planning, policy, and investment decisions.
This summary was produced with help from an AI and may contain inaccuracies - check out the links to read the original source documents!
Related Papers
Automated National Urban Map Extraction
Hasan Nasrallah, Abed Ellatif Samhat, Cristiano Nattero, Ali J. Ghandour
0
0
Developing countries usually lack the proper governance means to generate and regularly update a national rooftop map. Using traditional photogrammetry and surveying methods to produce a building map at the federal level is costly and time consuming. Using earth observation and deep learning methods, we can bridge this gap and propose an automated pipeline to fetch such national urban maps. This paper aims to exploit the power of fully convolutional neural networks for multi-class buildings' instance segmentation to leverage high object-wise accuracy results. Buildings' instance segmentation from sub-meter high-resolution satellite images can be achieved with relatively high pixel-wise metric scores. We detail all engineering steps to replicate this work and ensure highly accurate results in dense and slum areas witnessed in regions that lack proper urban planning in the Global South. We applied a case study of the proposed pipeline to Lebanon and successfully produced the first comprehensive national building footprint map with approximately 1 Million units with an 84% accuracy. The proposed architecture relies on advanced augmentation techniques to overcome dataset scarcity, which is often the case in developing countries.
5/6/2024
🤿
Deep learning-based hyperspectral image reconstruction for quality assessment of agro-product
Md. Toukir Ahmed, Ocean Monjur, Mohammed Kamruzzaman
0
0
Hyperspectral imaging (HSI) has recently emerged as a promising tool for many agricultural applications; however, the technology cannot be directly used in a real-time system due to the extensive time needed to process large volumes of data. Consequently, the development of a simple, compact, and cost-effective imaging system is not possible with the current HSI systems. Therefore, the overall goal of this study was to reconstruct hyperspectral images from RGB images through deep learning for agricultural applications. Specifically, this study used Hyperspectral Convolutional Neural Network - Dense (HSCNN-D) to reconstruct hyperspectral images from RGB images for predicting soluble solid content (SSC) in sweet potatoes. The algorithm accurately reconstructed the hyperspectral images from RGB images, with the resulting spectra closely matching the ground-truth. The partial least squares regression (PLSR) model based on reconstructed spectra outperformed the model using the full spectral range, demonstrating its potential for SSC prediction in sweet potatoes. These findings highlight the potential of deep learning-based hyperspectral image reconstruction as a low-cost, efficient tool for various agricultural uses.
5/22/2024
🖼️
Comparative Analysis of Hyperspectral Image Reconstruction Using Deep Learning for Agricultural and Biological Applications
Md. Toukir Ahmed, Arthur Villordon, Mohammed Kamruzzaman
0
0
Hyperspectral imaging (HSI) has become a key technology for non-invasive quality evaluation in various fields, offering detailed insights through spatial and spectral data. Despite its efficacy, the complexity and high cost of HSI systems have hindered their widespread adoption. This study addressed these challenges by exploring deep learning-based hyperspectral image reconstruction from RGB (Red, Green, Blue) images, particularly for agricultural products. Specifically, different hyperspectral reconstruction algorithms, such as Hyperspectral Convolutional Neural Network - Dense (HSCNN-D), High-Resolution Network (HRNET), and Multi-Scale Transformer Plus Plus (MST++), were compared to assess the dry matter content of sweet potatoes. Among the tested reconstruction methods, HRNET demonstrated superior performance, achieving the lowest mean relative absolute error (MRAE) of 0.07, root mean square error (RMSE) of 0.03, and the highest peak signal-to-noise ratio (PSNR) of 32.28 decibels (dB). Some key features were selected using the genetic algorithm (GA), and their importance was interpreted using explainable artificial intelligence (XAI). Partial least squares regression (PLSR) models were developed using the RGB, reconstructed, and ground truth (GT) data. The visual and spectra quality of these reconstructed methods was compared with GT data, and predicted maps were generated. The results revealed the prospect of deep learning-based hyperspectral image reconstruction as a cost-effective and efficient quality assessment tool for agricultural and biological applications.
6/4/2024
From Pixels to Progress: Generating Road Network from Satellite Imagery for Socioeconomic Insights in Impoverished Areas
Yanxin Xi, Yu Liu, Zhicheng Liu, Sasu Tarkoma, Pan Hui, Yong Li
0
0
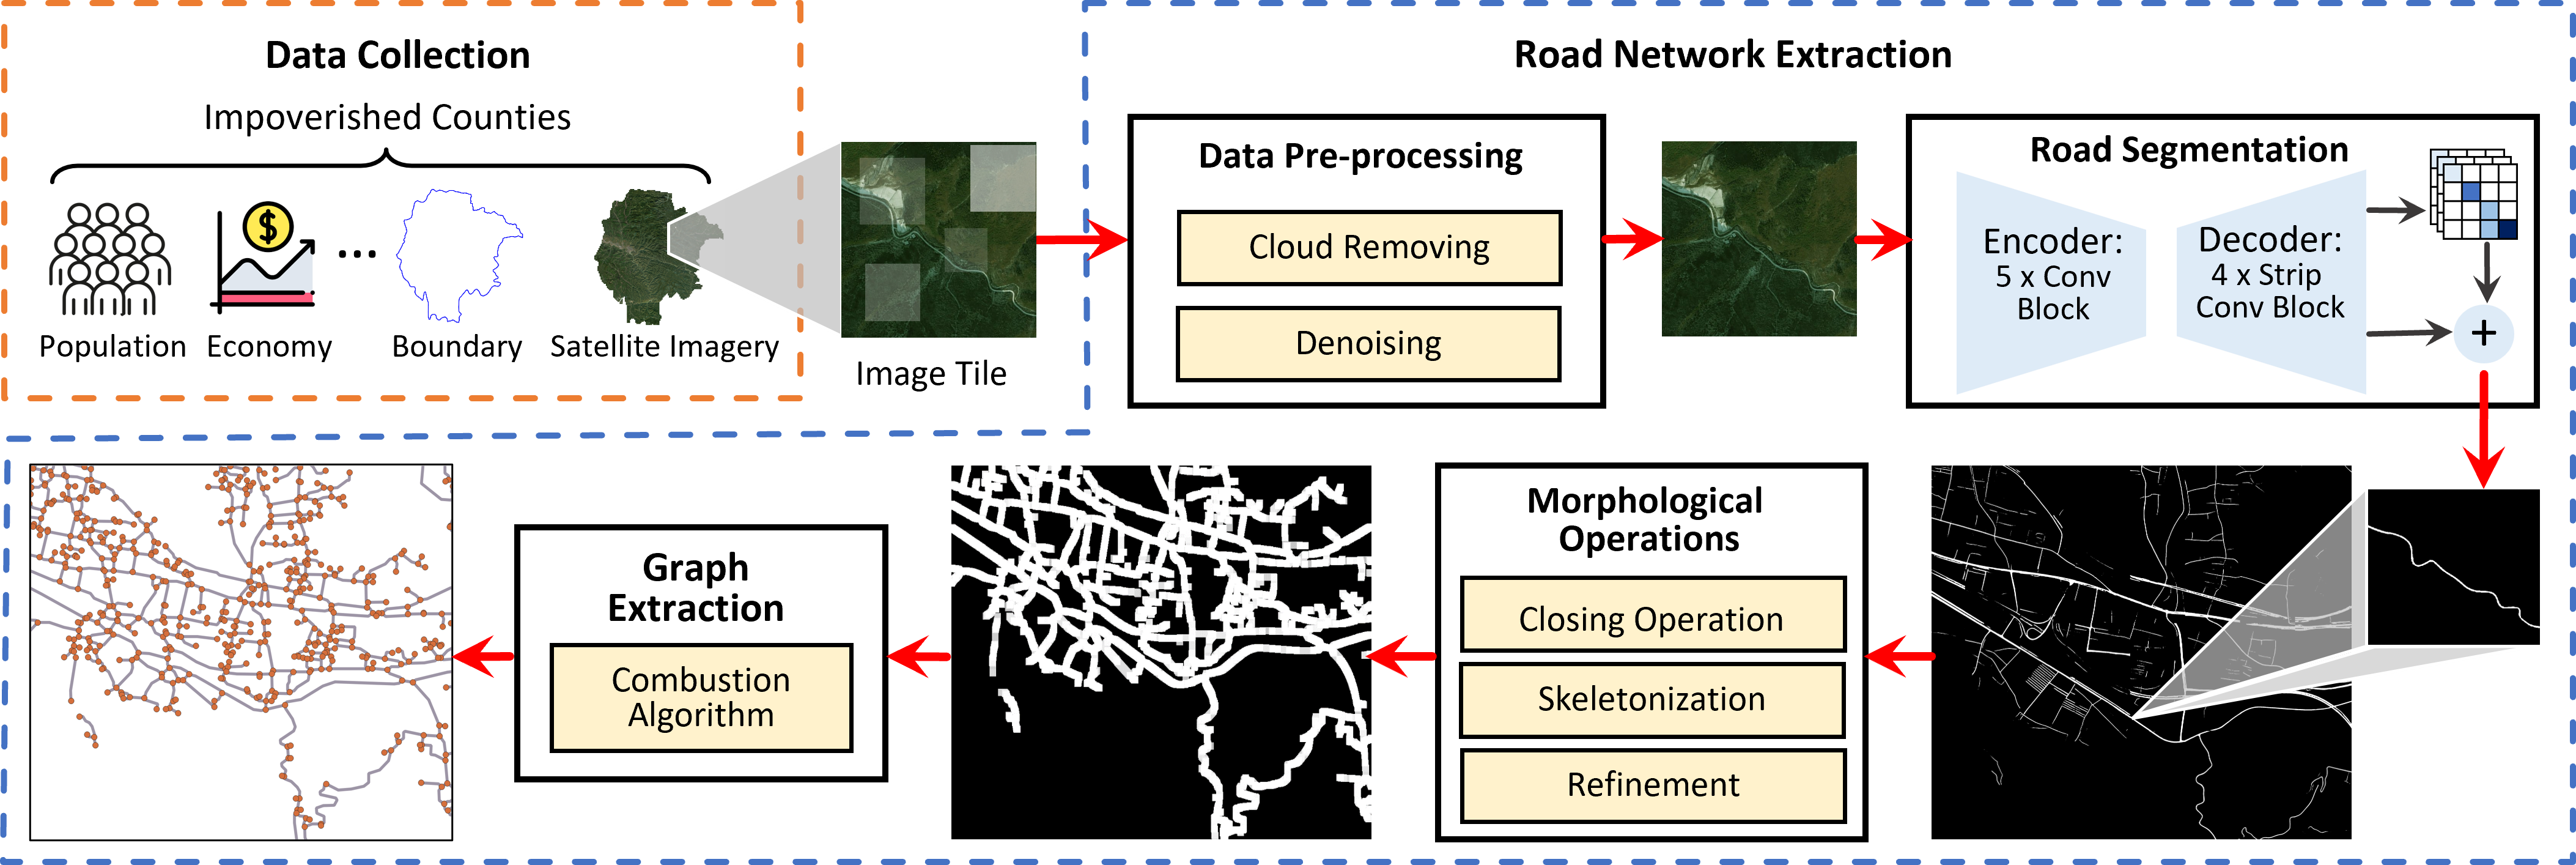
The Sustainable Development Goals (SDGs) aim to resolve societal challenges, such as eradicating poverty and improving the lives of vulnerable populations in impoverished areas. Those areas rely on road infrastructure construction to promote accessibility and economic development. Although publicly available data like OpenStreetMap is available to monitor road status, data completeness in impoverished areas is limited. Meanwhile, the development of deep learning techniques and satellite imagery shows excellent potential for earth monitoring. To tackle the challenge of road network assessment in impoverished areas, we develop a systematic road extraction framework combining an encoder-decoder architecture and morphological operations on satellite imagery, offering an integrated workflow for interdisciplinary researchers. Extensive experiments of road network extraction on real-world data in impoverished regions achieve a 42.7% enhancement in the F1-score over the baseline methods and reconstruct about 80% of the actual roads. We also propose a comprehensive road network dataset covering approximately 794,178 km2 area and 17.048 million people in 382 impoverished counties in China. The generated dataset is further utilized to conduct socioeconomic analysis in impoverished counties, showing that road network construction positively impacts regional economic development. The technical appendix, code, and generated dataset can be found at https://github.com/tsinghua-fib-lab/Road_network_extraction_impoverished_counties.
6/18/2024