VisEval: A Benchmark for Data Visualization in the Era of Large Language Models

0
Sign in to get full access
Overview
- Introduces a benchmark called VisEval for evaluating large language models' ability to generate data visualizations from natural language descriptions
- Compares VisEval to other related benchmarks like VILLM-Eval, QualEval, K-VisKit, and GraphEval2000
- Focuses on evaluating the quality and faithfulness of generated visualizations compared to target visualizations
Plain English Explanation
The paper introduces a new benchmark called VisEval that is designed to evaluate how well large language models can generate data visualizations from natural language descriptions. This is an important task as these models are increasingly being used to automatically create visualizations from text.
The VisEval benchmark includes a diverse set of visualization types and data domains, allowing for a comprehensive evaluation of a model's capabilities. It measures not just the visual quality of the generated visualizations, but also how well they match the original textual descriptions.
This is an important advance over previous benchmarks like VILLM-Eval and QualEval, which focused more on general natural language generation abilities. VisEval is specifically tailored to the task of automated data visualization, providing a more targeted and relevant evaluation.
The authors also compare VisEval to other visualization-focused benchmarks like K-VisKit and GraphEval2000, highlighting how VisEval offers a more comprehensive and challenging set of samples and evaluation criteria.
Overall, the VisEval benchmark represents an important step forward in assessing the capabilities of large language models to generate high-quality and faithful data visualizations from natural language descriptions.
Technical Explanation
The paper introduces a new benchmark called VisEval for evaluating the ability of large language models to generate data visualizations from natural language descriptions. The benchmark includes a diverse set of 1,000 visualization samples across 10 different data domains, such as sports, finance, and science.
Each sample consists of a natural language prompt describing a desired visualization, along with a corresponding target visualization created by human designers. The benchmark evaluates generated visualizations on two main criteria:
-
Visual Quality: Assessing the aesthetic and technical qualities of the generated visualization, such as appropriate use of visual encodings, layout, and chart type.
-
Faithfulness: Evaluating how well the generated visualization matches and captures the information and insights described in the natural language prompt.
The authors compare VisEval to other related benchmarks, such as VILLM-Eval, QualEval, K-VisKit, and GraphEval2000. They highlight how VisEval offers a more comprehensive and challenging evaluation of visualization generation capabilities compared to these other benchmarks.
The paper also discusses the potential applications of VisEval, such as guiding the development of more effective large language models for automated data visualization, and facilitating research on the intersection of natural language processing and data visualization.
Critical Analysis
The VisEval benchmark represents a significant advancement in the field of automated data visualization from natural language, as it provides a comprehensive and rigorous evaluation framework. However, the paper does acknowledge some potential limitations and areas for further research:
Limitations:
- The benchmark is currently limited to 2D static visualizations and does not include dynamic or interactive visualizations.
- The evaluation criteria, while well-defined, may not capture all aspects of visualization quality and faithfulness.
- The dataset, while diverse, may not be fully representative of the wide range of visualization types and data domains used in real-world scenarios.
Areas for Further Research:
- Expanding VisEval to include a broader range of visualization types, such as interactive or animated visualizations, and evaluating their generation.
- Developing more sophisticated evaluation metrics that can better capture the nuances of visualization quality and faithfulness.
- Investigating the performance of different large language model architectures and training strategies on the VisEval benchmark.
- Exploring the potential for VisEval to be used as a training dataset or fine-tuning resource for improving the visualization generation capabilities of large language models.
Overall, the VisEval benchmark represents a valuable contribution to the field of automated data visualization, and the authors' critical analysis highlights opportunities for further research and development in this rapidly evolving area.
Conclusion
The VisEval benchmark introduced in this paper provides a comprehensive and targeted evaluation of large language models' ability to generate high-quality and faithful data visualizations from natural language descriptions. By offering a diverse set of visualization samples and rigorous evaluation criteria, VisEval represents an important step forward in assessing the current state-of-the-art in this emerging field.
The comparison to related benchmarks underscores the unique value of VisEval in focusing specifically on the task of automated data visualization, which is becoming increasingly important as large language models are adopted for a wide range of applications. While the paper acknowledges some limitations, the authors also highlight promising avenues for future research and development.
Overall, the VisEval benchmark sets a new standard for evaluating the performance of large language models in the context of data visualization, and its widespread adoption has the potential to drive significant advancements in this crucial intersection of natural language processing and data visualization.
This summary was produced with help from an AI and may contain inaccuracies - check out the links to read the original source documents!
Related Papers
0
VisEval: A Benchmark for Data Visualization in the Era of Large Language Models
Nan Chen, Yuge Zhang, Jiahang Xu, Kan Ren, Yuqing Yang
Translating natural language to visualization (NL2VIS) has shown great promise for visual data analysis, but it remains a challenging task that requires multiple low-level implementations, such as natural language processing and visualization design. Recent advancements in pre-trained large language models (LLMs) are opening new avenues for generating visualizations from natural language. However, the lack of a comprehensive and reliable benchmark hinders our understanding of LLMs' capabilities in visualization generation. In this paper, we address this gap by proposing a new NL2VIS benchmark called VisEval. Firstly, we introduce a high-quality and large-scale dataset. This dataset includes 2,524 representative queries covering 146 databases, paired with accurately labeled ground truths. Secondly, we advocate for a comprehensive automated evaluation methodology covering multiple dimensions, including validity, legality, and readability. By systematically scanning for potential issues with a number of heterogeneous checkers, VisEval provides reliable and trustworthy evaluation outcomes. We run VisEval on a series of state-of-the-art LLMs. Our evaluation reveals prevalent challenges and delivers essential insights for future advancements.
Read more8/9/2024
0
Automated Data Visualization from Natural Language via Large Language Models: An Exploratory Study
Yang Wu, Yao Wan, Hongyu Zhang, Yulei Sui, Wucai Wei, Wei Zhao, Guandong Xu, Hai Jin
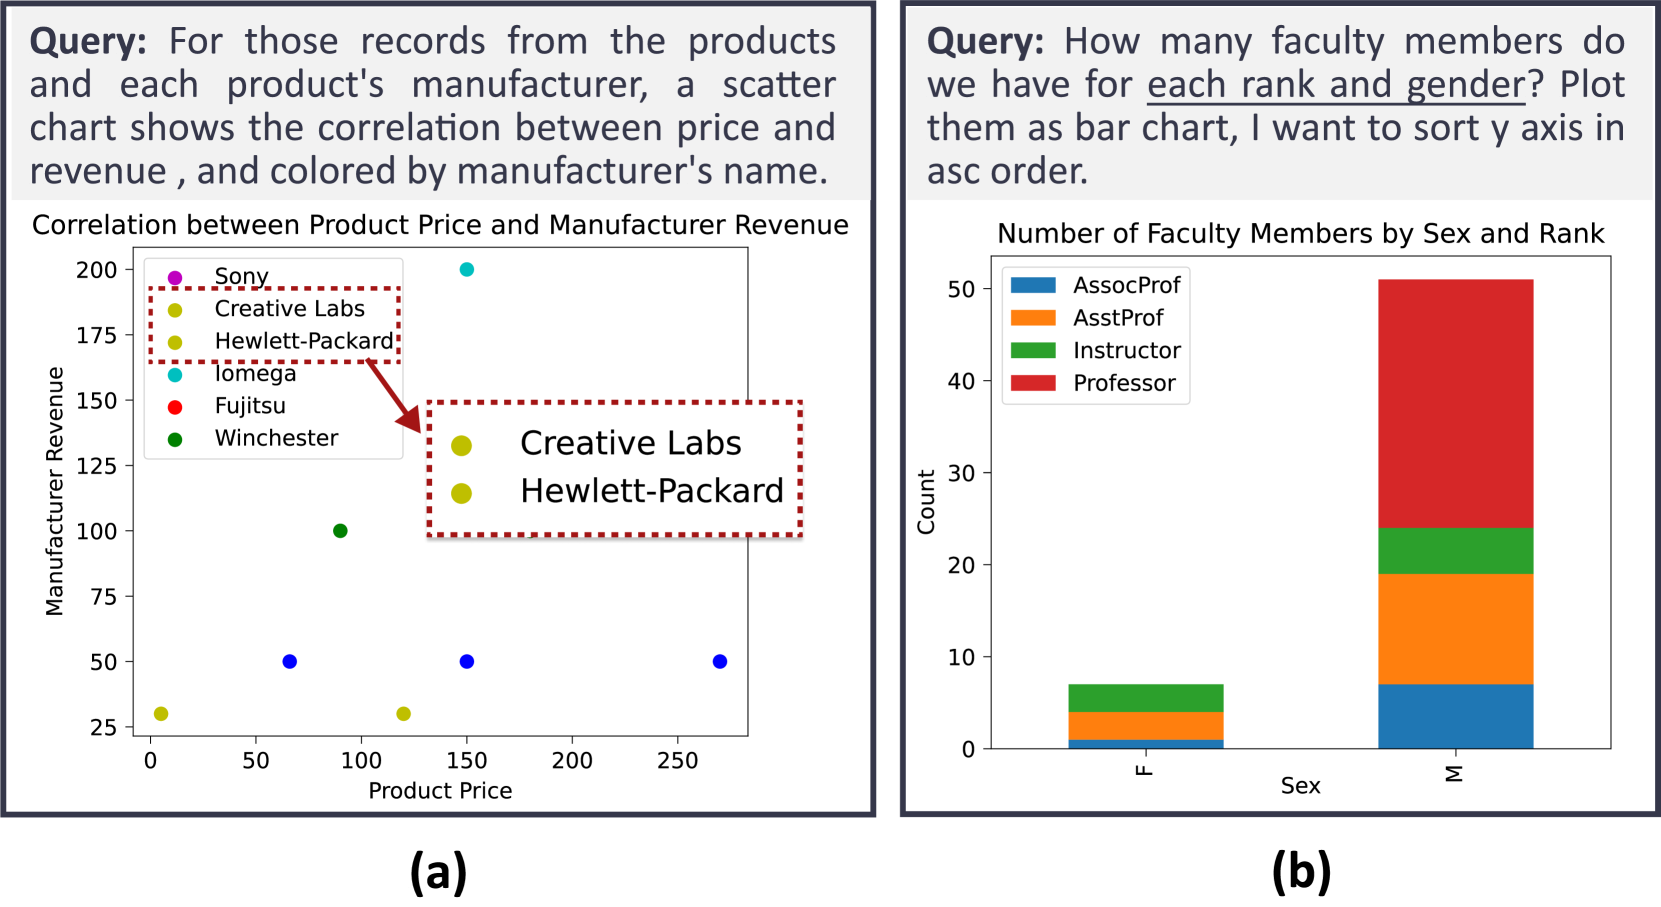
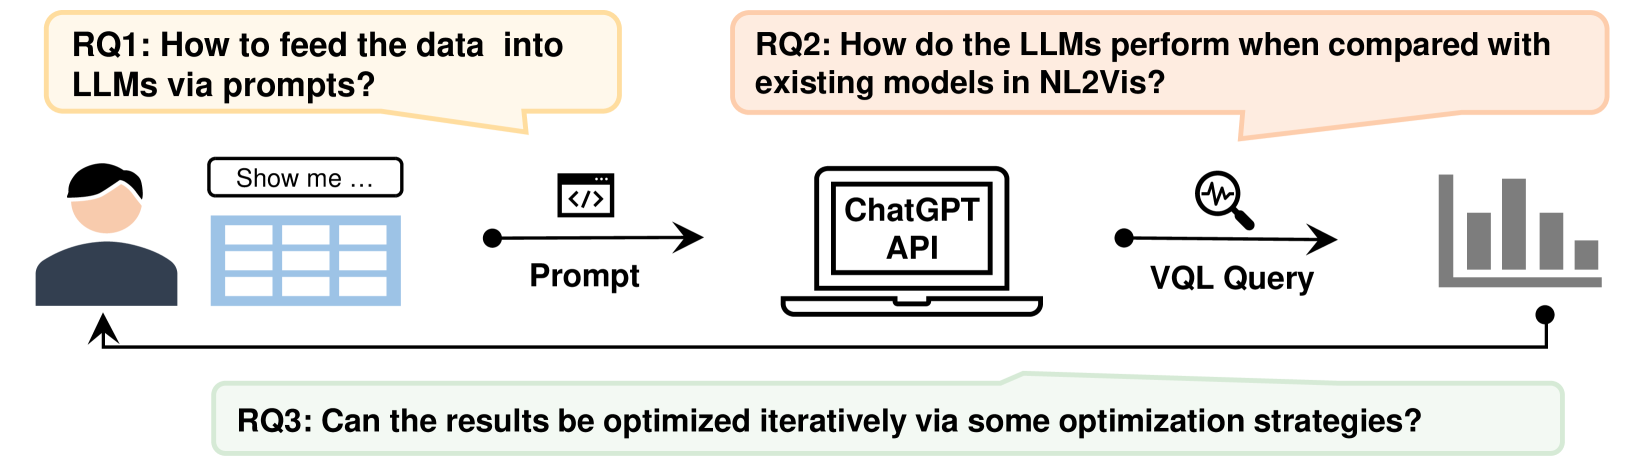
The Natural Language to Visualization (NL2Vis) task aims to transform natural-language descriptions into visual representations for a grounded table, enabling users to gain insights from vast amounts of data. Recently, many deep learning-based approaches have been developed for NL2Vis. Despite the considerable efforts made by these approaches, challenges persist in visualizing data sourced from unseen databases or spanning multiple tables. Taking inspiration from the remarkable generation capabilities of Large Language Models (LLMs), this paper conducts an empirical study to evaluate their potential in generating visualizations, and explore the effectiveness of in-context learning prompts for enhancing this task. In particular, we first explore the ways of transforming structured tabular data into sequential text prompts, as to feed them into LLMs and analyze which table content contributes most to the NL2Vis. Our findings suggest that transforming structured tabular data into programs is effective, and it is essential to consider the table schema when formulating prompts. Furthermore, we evaluate two types of LLMs: finetuned models (e.g., T5-Small) and inference-only models (e.g., GPT-3.5), against state-of-the-art methods, using the NL2Vis benchmarks (i.e., nvBench). The experimental results reveal that LLMs outperform baselines, with inference-only models consistently exhibiting performance improvements, at times even surpassing fine-tuned models when provided with certain few-shot demonstrations through in-context learning. Finally, we analyze when the LLMs fail in NL2Vis, and propose to iteratively update the results using strategies such as chain-of-thought, role-playing, and code-interpreter. The experimental results confirm the efficacy of iterative updates and hold great potential for future study.
Read more4/29/2024
0
PUB: Plot Understanding Benchmark and Dataset for Evaluating Large Language Models on Synthetic Visual Data Interpretation
Aneta Pawelec, Victoria Sara Weso{l}owska, Zuzanna Bk{a}czek, Piotr Sankowski
The ability of large language models (LLMs) to interpret visual representations of data is crucial for advancing their application in data analysis and decision-making processes. This paper presents a novel synthetic dataset designed to evaluate the proficiency of LLMs in interpreting various forms of data visualizations, including plots like time series, histograms, violins, boxplots, and clusters. Our dataset is generated using controlled parameters to ensure comprehensive coverage of potential real-world scenarios. We employ multimodal text prompts with questions related to visual data in images to benchmark several state-of-the-art models like ChatGPT or Gemini, assessing their understanding and interpretative accuracy. To ensure data integrity, our benchmark dataset is generated automatically, making it entirely new and free from prior exposure to the models being tested. This strategy allows us to evaluate the models' ability to truly interpret and understand the data, eliminating possibility of pre-learned responses, and allowing for an unbiased evaluation of the models' capabilities. We also introduce quantitative metrics to assess the performance of the models, providing a robust and comprehensive evaluation tool. Benchmarking several state-of-the-art LLMs with this dataset reveals varying degrees of success, highlighting specific strengths and weaknesses in interpreting diverse types of visual data. The results provide valuable insights into the current capabilities of LLMs and identify key areas for improvement. This work establishes a foundational benchmark for future research and development aimed at enhancing the visual interpretative abilities of language models. In the future, improved LLMs with robust visual interpretation skills can significantly aid in automated data analysis, scientific research, educational tools, and business intelligence applications.
Read more9/5/2024

0
Do Text-to-Vis Benchmarks Test Real Use of Visualisations?
Hy Nguyen, Xuefei He, Andrew Reeson, Cecile Paris, Josiah Poon, Jonathan K. Kummerfeld
Large language models are able to generate code for visualisations in response to user requests. This is a useful application, and an appealing one for NLP research because plots of data provide grounding for language. However, there are relatively few benchmarks, and it is unknown whether those that exist are representative of what people do in practice. This paper aims to answer that question through an empirical study comparing benchmark datasets and code from public repositories. Our findings reveal a substantial gap in datasets, with evaluations not testing the same distribution of chart types, attributes, and the number of actions. The only representative dataset requires modification to become an end-to-end and practical benchmark. This shows that new, more benchmarks are needed to support the development of systems that truly address users' visualisation needs. These observations will guide future data creation, highlighting which features hold genuine significance for users.
Read more8/16/2024