Evaluating Task-based Effectiveness of MLLMs on Charts

0
🔗
Sign in to get full access
Overview
- This paper explores the effectiveness of GPT-4V, a large language model, in performing low-level data analysis tasks on charts.
- The researchers first curate a large-scale dataset called ChartInsights, which includes 89,388 quartets (chart, task, question, answer) covering 10 common low-level data analysis tasks on 7 chart types.
- They systematically evaluate the capabilities and limitations of 18 advanced machine learning language models, including both open-source and closed-source models.
- The researchers find that GPT-4V achieves the highest accuracy among the evaluated models, reaching 56.13%.
- To further understand the limitations of multimodal large models in low-level data analysis tasks, the researchers design various experiments to test the capabilities of GPT-4V.
- They also investigate how visual modifications to charts, such as altering visual elements or introducing perturbations, affect the performance of GPT-4V.
- The researchers propose a novel textual prompt strategy, called Chain-of-Charts, which boosts the model's performance by 24.36%, resulting in an accuracy of 80.49%.
- They also incorporate a visual prompt strategy that directs the attention of GPT-4V to question-relevant visual elements, further improving the accuracy to 83.83%.
Plain English Explanation
In this study, the researchers wanted to find out how well a powerful AI language model called GPT-4V can perform low-level data analysis tasks on charts and graphs. To do this, they first created a large dataset called ChartInsights, which includes nearly 90,000 examples of charts, tasks, questions, and answers.
The researchers then tested 18 different AI language models, including GPT-4V, to see how well they could analyze the charts and answer questions about them. They found that GPT-4V was the most accurate, getting 56% of the questions right on average.
To better understand the strengths and weaknesses of GPT-4V, the researchers designed more advanced experiments. They looked at how changes to the charts, like altering the colors or adding noise, affected the model's performance. They also tried different ways of prompting the model to see if they could improve its accuracy.
The researchers found that by using a special prompting technique they called Chain-of-Charts, they were able to boost GPT-4V's accuracy to 80%. And by also directing the model's attention to the relevant visual elements of the charts, they were able to further improve the accuracy to nearly 84%.
Overall, this study provides valuable insights into the capabilities and limitations of large language models like GPT-4V when it comes to working with charts and graphs. The researchers hope their findings will help guide future developments in this area of AI.
Technical Explanation
The researchers first curated a large-scale dataset called ChartInsights, which consists of 89,388 quartets (chart, task, question, answer) covering 10 widely-used low-level data analysis tasks on 7 chart types. This dataset was used to systematically evaluate the capabilities and limitations of 18 advanced machine learning language models (MLLMs), including 12 open-source models and 6 closed-source models.
Using a standard textual prompt approach, the average accuracy rate across the 18 MLLMs was 36.17%. Among all the models, GPT-4V achieved the highest accuracy, reaching 56.13%.
To further understand the limitations of multimodal large models in low-level data analysis tasks, the researchers designed various experiments to test the capabilities of GPT-4V. They investigated how visual modifications to charts, such as altering visual elements (e.g., changing color schemes) and introducing perturbations (e.g., adding image noise), affected the model's performance.
The researchers then proposed a novel textual prompt strategy, named Chain-of-Charts, which was tailored for low-level analysis tasks. This approach boosted the model's performance by 24.36%, resulting in an accuracy of 80.49%. Furthermore, by incorporating a visual prompt strategy that directed the attention of GPT-4V to question-relevant visual elements, they further improved the accuracy to 83.83%.
Critical Analysis
The researchers acknowledge several limitations and areas for further research in their paper. They note that the ChartInsights dataset, while large-scale, may not fully capture the breadth of real-world chart analysis tasks and that additional datasets may be needed to further evaluate the capabilities of large language models.
Additionally, the researchers point out that the visual prompt strategy they introduced relies on human annotations to identify the relevant visual elements, which may not be scalable or practical in a real-world setting. Exploring ways to automate this process or develop more generalized visual prompt strategies could be an important area for future research.
While the researchers have made significant progress in understanding the capabilities of GPT-4V in low-level data analysis tasks, there are still many open questions about the robustness and generalizability of these models. For example, it's unclear how well GPT-4V would perform on more complex or domain-specific chart analysis tasks, or how it would handle novel chart types or visual perturbations not seen during training.
Furthermore, the paper does not delve deeply into the potential biases or limitations of the underlying language model, which could have important implications for the reliability and fairness of the system's outputs. Exploring these issues in more depth could be valuable for understanding the broader implications of using large language models for data analysis tasks.
Conclusion
This study provides valuable insights into the capabilities and limitations of the large language model GPT-4V when it comes to performing low-level data analysis tasks on charts. The researchers have curated a large-scale dataset, conducted systematic evaluations, and proposed novel prompt strategies to improve the model's performance.
The findings suggest that GPT-4V has significant potential to revolutionize the way people interact with and analyze charts, but also highlight the gap between human analytic needs and the current capabilities of large multimodal models. The researchers' work offers a roadmap for future research and development in this area, with the ultimate goal of creating AI systems that can seamlessly and reliably assist humans in their data analysis tasks.
This summary was produced with help from an AI and may contain inaccuracies - check out the links to read the original source documents!
Related Papers
🔗
0
Evaluating Task-based Effectiveness of MLLMs on Charts
Yifan Wu, Lutao Yan, Yuyu Luo, Yunhai Wang, Nan Tang
In this paper, we explore a forward-thinking question: Is GPT-4V effective at low-level data analysis tasks on charts? To this end, we first curate a large-scale dataset, named ChartInsights, consisting of 89,388 quartets (chart, task, question, answer) and covering 10 widely-used low-level data analysis tasks on 7 chart types. Firstly, we conduct systematic evaluations to understand the capabilities and limitations of 18 advanced MLLMs, which include 12 open-source models and 6 closed-source models. Starting with a standard textual prompt approach, the average accuracy rate across the 18 MLLMs is 36.17%. Among all the models, GPT-4V achieves the highest accuracy, reaching 56.13%. To understand the limitations of multimodal large models in low-level data analysis tasks, we have designed various experiments to conduct an in-depth test of capabilities of GPT-4V. We further investigate how visual modifications to charts, such as altering visual elements (e.g. changing color schemes) and introducing perturbations (e.g. adding image noise), affect performance of GPT-4V. Secondly, we present 12 experimental findings. These findings suggest potential of GPT-4V to revolutionize interaction with charts and uncover the gap between human analytic needs and capabilities of GPT-4V. Thirdly, we propose a novel textual prompt strategy, named Chain-of-Charts, tailored for low-level analysis tasks, which boosts model performance by 24.36%, resulting in an accuracy of 80.49%. Furthermore, by incorporating a visual prompt strategy that directs attention of GPT-4V to question-relevant visual elements, we further improve accuracy to 83.83%. Our study not only sheds light on the capabilities and limitations of GPT-4V in low-level data analysis tasks but also offers valuable insights for future research.
Read more6/18/2024
0
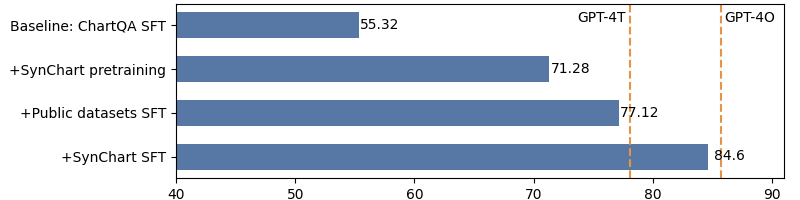
SynChart: Synthesizing Charts from Language Models
Mengchen Liu, Qixiu Li, Dongdong Chen, Dong Chen, Jianmin Bao, Yunsheng Li
With the release of GPT-4V(O), its use in generating pseudo labels for multi-modality tasks has gained significant popularity. However, it is still a secret how to build such advanced models from its base large language models (LLMs). This work explores the potential of using LLMs alone for data generation and develop competitive multi-modality models focusing on chart understanding. We construct a large-scale chart dataset, SynChart, which contains approximately 4 million diverse chart images with over 75 million dense annotations, including data tables, code, descriptions, and question-answer sets. We trained a 4.2B chart-expert model using this dataset and achieve near-GPT-4O performance on the ChartQA task, surpassing GPT-4V.
Read more9/26/2024
📊
0
New!Charting the Future: Using Chart Question-Answering for Scalable Evaluation of LLM-Driven Data Visualizations
James Ford, Xingmeng Zhao, Dan Schumacher, Anthony Rios
We propose a novel framework that leverages Visual Question Answering (VQA) models to automate the evaluation of LLM-generated data visualizations. Traditional evaluation methods often rely on human judgment, which is costly and unscalable, or focus solely on data accuracy, neglecting the effectiveness of visual communication. By employing VQA models, we assess data representation quality and the general communicative clarity of charts. Experiments were conducted using two leading VQA benchmark datasets, ChartQA and PlotQA, with visualizations generated by OpenAI's GPT-3.5 Turbo and Meta's Llama 3.1 70B-Instruct models. Our results indicate that LLM-generated charts do not match the accuracy of the original non-LLM-generated charts based on VQA performance measures. Moreover, while our results demonstrate that few-shot prompting significantly boosts the accuracy of chart generation, considerable progress remains to be made before LLMs can fully match the precision of human-generated graphs. This underscores the importance of our work, which expedites the research process by enabling rapid iteration without the need for human annotation, thus accelerating advancements in this field.
Read more9/30/2024

0
ChartX & ChartVLM: A Versatile Benchmark and Foundation Model for Complicated Chart Reasoning
Renqiu Xia, Bo Zhang, Hancheng Ye, Xiangchao Yan, Qi Liu, Hongbin Zhou, Zijun Chen, Min Dou, Botian Shi, Junchi Yan, Yu Qiao
Recently, many versatile Multi-modal Large Language Models (MLLMs) have emerged continuously. However, their capacity to query information depicted in visual charts and engage in reasoning based on the queried contents remains under-explored. In this paper, to comprehensively and rigorously benchmark the ability of the off-the-shelf MLLMs in the chart domain, we construct ChartX, a multi-modal evaluation set covering 18 chart types, 7 chart tasks, 22 disciplinary topics, and high-quality chart data. Besides, we develop ChartVLM to offer a new perspective on handling multi-modal tasks that strongly depend on interpretable patterns, such as reasoning tasks in the field of charts or geometric images. We evaluate the chart-related ability of mainstream MLLMs and our ChartVLM on the proposed ChartX evaluation set. Extensive experiments demonstrate that ChartVLM surpasses both versatile and chart-related large models, achieving results comparable to GPT-4V. We believe that our study can pave the way for further exploration in creating a more comprehensive chart evaluation set and developing more interpretable multi-modal models. Both ChartX and ChartVLM are available at: https://github.com/UniModal4Reasoning/ChartVLM
Read more9/12/2024