InsigHTable: Insight-driven Hierarchical Table Visualization with Reinforcement Learning

0

Sign in to get full access
Overview
- Presents InsigHTable, a novel system that uses reinforcement learning to automatically generate hierarchical table visualizations from complex data
- Aims to extract meaningful insights and present them in an intuitive, interactive tabular format
- Leverages reinforcement learning to optimize the visualization layout and enable data transformation operations
Plain English Explanation
InsigHTable is a data visualization tool that uses machine learning to automatically create hierarchical table layouts from complex, structured data. The key idea is to go beyond simple table displays and instead generate visualizations that highlight the most important insights and relationships in the data.
To do this, InsigHTable employs a reinforcement learning approach. The system is trained on example data and table layouts, and it learns to make iterative decisions about how to best organize and present the information. This allows it to dynamically transform the data and experiment with different visual formats to surface the most meaningful insights.
The end result is an interactive table view that gives users the ability to easily explore the data, drill down into specifics, and uncover hidden patterns. Rather than just dumping raw data into a grid, InsigHTable tries to intelligently curate and structure the presentation to maximize understanding and discovery.
This type of automated, insight-driven table visualization could be particularly useful for working with large, complex datasets that would be challenging for humans to navigate through manually. By tapping into the pattern recognition and optimization capabilities of machine learning, InsigHTable aims to make data exploration more efficient and rewarding.
Technical Explanation
The core of InsigHTable is a reinforcement learning (RL) agent that learns to generate effective hierarchical table layouts. The agent is trained on a dataset of example tables, which allows it to learn the characteristics of good visualizations. During inference, the agent iteratively makes decisions about how to structure the table, such as which columns to group, what sorting criteria to apply, and how to handle missing values.
The RL agent is rewarded for producing table layouts that maximize certain objective measures, like information density and visual saliency of key insights. This encourages the system to go beyond simple grid-based displays and instead create more sophisticated, insight-driven visualizations.
InsigHTable also incorporates data transformation capabilities, allowing the RL agent to perform operations like filtering, aggregation, and feature engineering. This gives the system more flexibility to uncover and highlight important patterns in the data.
The authors evaluate InsigHTable on a range of benchmark datasets and show that it can generate hierarchical tables that are preferred by human users over traditional tabular displays. The system also outperforms other automated data visualization techniques in terms of conveying insights.
Critical Analysis
The InsigHTable paper presents a novel and promising approach to automated data visualization, but there are a few caveats to consider:
- The reinforcement learning training process can be complex and computationally intensive, which may limit the scalability of the system for very large datasets.
- The objective functions used to reward the RL agent may not always align perfectly with human notions of insight and usability. More research is needed to fully understand the strengths and limitations of this approach.
- The paper focuses on structured, tabular data, but many real-world datasets have more diverse and unstructured formats. Extending the InsigHTable approach to handle a wider range of data types could be an area for future work.
Overall, the InsigHTable research represents an interesting step forward in the field of automated data visualization. By leveraging machine learning techniques like reinforcement learning and data transformation, the system demonstrates the potential to create more interpretable and insightful table visualizations. Further research in this area could lead to significant advancements in hierarchical data exploration and knowledge discovery.
Conclusion
InsigHTable presents a novel approach to automated data visualization that uses reinforcement learning to generate interactive, insight-driven hierarchical table layouts. By optimizing for measures like information density and visual salience of key insights, the system aims to go beyond simple grid-based displays and instead create visualizations that help users quickly uncover patterns and relationships in complex data.
While the paper demonstrates promising results, there are still some challenges and limitations to address, such as the computational complexity of the RL training process and the potential misalignment between the system's objectives and human notions of insight. Nevertheless, the InsigHTable research represents an important step forward in the field of automated data visualization, and continued work in this area could lead to significant advancements in how we interact with and make sense of large, complex datasets.
This summary was produced with help from an AI and may contain inaccuracies - check out the links to read the original source documents!
Related Papers
0
InsigHTable: Insight-driven Hierarchical Table Visualization with Reinforcement Learning
Guozheng Li, Peng He, Xinyu Wang, Runfei Li, Chi Harold Liu, Chuangxin Ou, Dong He, Guoren Wang
Embedding visual representations within original hierarchical tables can mitigate additional cognitive load stemming from the division of users' attention. The created hierarchical table visualizations can help users understand and explore complex data with multi-level attributes. However, because of many options available for transforming hierarchical tables and selecting subsets for embedding, the design space of hierarchical table visualizations becomes vast, and the construction process turns out to be tedious, hindering users from constructing hierarchical table visualizations with many data insights efficiently. We propose InsigHTable, a mixed-initiative and insight-driven hierarchical table transformation and visualization system. We first define data insights within hierarchical tables, which consider the hierarchical structure in the table headers. Since hierarchical table visualization construction is a sequential decision-making process, InsigHTable integrates a deep reinforcement learning framework incorporating an auxiliary rewards mechanism. This mechanism addresses the challenge of sparse rewards in constructing hierarchical table visualizations. Within the deep reinforcement learning framework, the agent continuously optimizes its decision-making process to create hierarchical table visualizations to uncover more insights by collaborating with analysts. We demonstrate the usability and effectiveness of InsigHTable through two case studies and sets of experiments. The results validate the effectiveness of the deep reinforcement learning framework and show that InsigHTable can facilitate users to construct hierarchical table visualizations and understand underlying data insights.
Read more5/28/2024
0
Beyond Embeddings: The Promise of Visual Table in Visual Reasoning
Yiwu Zhong, Zi-Yuan Hu, Michael R. Lyu, Liwei Wang
Visual representation learning has been a cornerstone in computer vision, involving typical forms such as visual embeddings, structural symbols, and text-based representations. Despite the success of CLIP-type visual embeddings, they often lack access to world knowledge critical for visual reasoning. In this work, we propose Visual Table, a novel form of visual representation tailored for visual reasoning. Visual tables are constructed as hierarchical descriptions of visual scenes, featuring a scene description and multiple object-centric descriptions covering categories, attributes, and knowledge. Thanks to the structural and textual formats, visual tables offer unique advantages over mere visual embeddings, such as interpretability and controllable editing. Furthermore, they deliver instance-level world knowledge and detailed attributes that are essential for visual reasoning. To create visual tables, we develop a generator trained on the dataset with collected, small-scale annotations. Extensive results on 11 visual reasoning benchmarks demonstrate that the generated visual tables significantly outperform previous structural and text-based representations. Moreover, they consistently enhance state-of-the-art multimodal large language models across diverse benchmarks, showcasing their potential for advancing visual reasoning tasks. Our code is available at https://github.com/LaVi-Lab/Visual-Table.
Read more6/18/2024

0
HAIChart: Human and AI Paired Visualization System
Yupeng Xie, Yuyu Luo, Guoliang Li, Nan Tang
The growing importance of data visualization in business intelligence and data science emphasizes the need for tools that can efficiently generate meaningful visualizations from large datasets. Existing tools fall into two main categories: human-powered tools (e.g., Tableau and PowerBI), which require intensive expert involvement, and AI-powered automated tools (e.g., Draco and Table2Charts), which often fall short of guessing specific user needs. In this paper, we aim to achieve the best of both worlds. Our key idea is to initially auto-generate a set of high-quality visualizations to minimize manual effort, then refine this process iteratively with user feedback to more closely align with their needs. To this end, we present HAIChart, a reinforcement learning-based framework designed to iteratively recommend good visualizations for a given dataset by incorporating user feedback. Specifically, we propose a Monte Carlo Graph Search-based visualization generation algorithm paired with a composite reward function to efficiently explore the visualization space and automatically generate good visualizations. We devise a visualization hints mechanism to actively incorporate user feedback, thus progressively refining the visualization generation module. We further prove that the top-k visualization hints selection problem is NP-hard and design an efficient algorithm. We conduct both quantitative evaluations and user studies, showing that HAIChart significantly outperforms state-of-the-art human-powered tools (21% better at Recall and 1.8 times faster) and AI-powered automatic tools (25.1% and 14.9% better in terms of Hit@3 and R10@30, respectively).
Read more9/10/2024
0
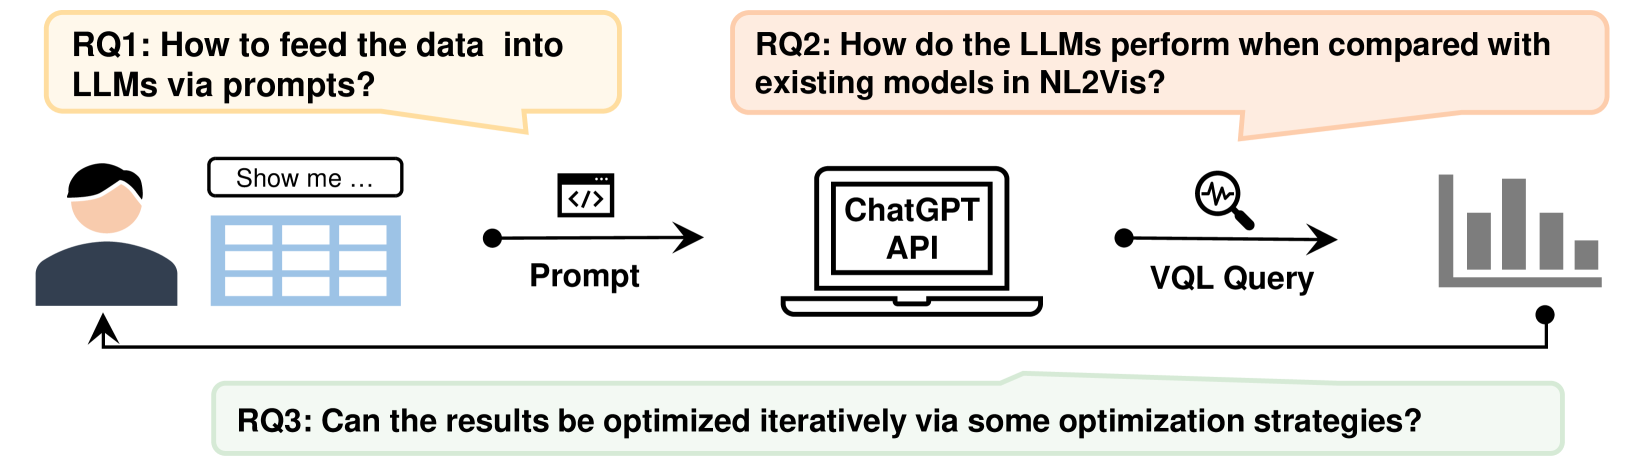
Automated Data Visualization from Natural Language via Large Language Models: An Exploratory Study
Yang Wu, Yao Wan, Hongyu Zhang, Yulei Sui, Wucai Wei, Wei Zhao, Guandong Xu, Hai Jin
The Natural Language to Visualization (NL2Vis) task aims to transform natural-language descriptions into visual representations for a grounded table, enabling users to gain insights from vast amounts of data. Recently, many deep learning-based approaches have been developed for NL2Vis. Despite the considerable efforts made by these approaches, challenges persist in visualizing data sourced from unseen databases or spanning multiple tables. Taking inspiration from the remarkable generation capabilities of Large Language Models (LLMs), this paper conducts an empirical study to evaluate their potential in generating visualizations, and explore the effectiveness of in-context learning prompts for enhancing this task. In particular, we first explore the ways of transforming structured tabular data into sequential text prompts, as to feed them into LLMs and analyze which table content contributes most to the NL2Vis. Our findings suggest that transforming structured tabular data into programs is effective, and it is essential to consider the table schema when formulating prompts. Furthermore, we evaluate two types of LLMs: finetuned models (e.g., T5-Small) and inference-only models (e.g., GPT-3.5), against state-of-the-art methods, using the NL2Vis benchmarks (i.e., nvBench). The experimental results reveal that LLMs outperform baselines, with inference-only models consistently exhibiting performance improvements, at times even surpassing fine-tuned models when provided with certain few-shot demonstrations through in-context learning. Finally, we analyze when the LLMs fail in NL2Vis, and propose to iteratively update the results using strategies such as chain-of-thought, role-playing, and code-interpreter. The experimental results confirm the efficacy of iterative updates and hold great potential for future study.
Read more4/29/2024