t-viSNE: Interactive Assessment and Interpretation of t-SNE Projections

0
🤿
Sign in to get full access
Overview
- t-SNE is a popular dimensionality reduction technique used to visualize high-dimensional data in a 2D or 3D space.
- While t-SNE is widely used, the resulting visualizations can be hard to interpret or even misleading, which undermines trust in the results.
- Understanding the details of t-SNE and the reasons behind specific patterns in its output can be challenging, especially for non-experts in dimensionality reduction.
Plain English Explanation
t-SNE is a tool that takes complex, high-dimensional data (like Tensor-Based Graph Learning for Consistency and Specificity in Multi-View Data) and creates a simplified, 2D or 3D visualization that makes it easier to understand. This can be really helpful for exploring and analyzing large datasets.
However, sometimes the t-SNE visualizations can be confusing or even misleading. It's not always clear why the data is arranged in a certain way, or what the different clusters or patterns represent. This can make it hard to trust the results, especially for people who aren't experts in this kind of data analysis.
The paper presents an interactive tool called t-viSNE that aims to make t-SNE visualizations more transparent and understandable. It lets you explore different aspects of the t-SNE process, like how the choice of parameters affects the results, or how well the visualized distances match the actual distances in the high-dimensional data. This can help you get a better sense of what the t-SNE visualization is actually telling you about your data.
By making the t-SNE process more accessible and interpretable, the researchers hope to support analysts in using t-SNE effectively and confidently, even if they're not dimensionality reduction experts. This could be especially useful for tasks like interpreting visual clusters in dimensionality reduction or scalable multi-view data visualization.
Technical Explanation
The paper presents t-viSNE, an interactive tool for visually exploring the results of t-SNE dimensionality reduction. t-SNE is a widely used technique for visualizing high-dimensional data in a 2D or 3D space, but the resulting projections can be hard to interpret, which undermines trust in the analysis.
t-viSNE provides a collection of different views that allow analysts to inspect various aspects of the t-SNE projection, such as:
- The effects of different hyperparameters on the visualization
- The preservation of distances and neighborhoods from the high-dimensional space
- The densities and costs of specific neighborhoods in the projection
- The correlations between dimensions and visual patterns
By enabling users to explore these details, t-viSNE aims to make the t-SNE process more transparent and the resulting visualizations more interpretable, even for non-experts in dimensionality reduction.
The paper demonstrates the applicability and usability of t-viSNE through hypothetical usage scenarios with real data sets, and presents the results of a user study evaluating the tool's effectiveness.
Critical Analysis
The researchers acknowledge that while t-SNE is a powerful dimensionality reduction technique, the resulting visualizations can be difficult to interpret, which undermines their trustworthiness. This is a well-known limitation of t-SNE that has been discussed in previous research, such as Interpretable Dimensionality Reduction by Feature Preserving Manifold Learning.
The development of t-viSNE is a promising approach to address this issue by providing analysts with more transparency and control over the t-SNE process. However, the paper does not discuss the potential limitations or downsides of the tool itself. For example, it's unclear how scalable t-viSNE is for very large datasets, or how it compares to other tools for exploring dimensionality reduction results, such as Approximate UMAP Allows High Rate Online Visualization.
Additionally, while the user study provides some evidence of the tool's effectiveness, the paper does not provide a detailed analysis of the study's methodology and results. More rigorous evaluation would be helpful to assess the tool's real-world impact and identify areas for further improvement.
Conclusion
The t-viSNE tool presented in this paper represents a valuable contribution to the field of dimensionality reduction and data visualization. By providing a more transparent and interpretable way to explore t-SNE projections, the researchers aim to support analysts in using this powerful technique more effectively and with greater confidence.
The tool's ability to shed light on the details and inner workings of t-SNE could be particularly useful for tasks that rely on dimensionality reduction, such as interpreting visual clusters or multi-view data visualization. By making the t-SNE process more accessible and understandable, t-viSNE has the potential to enhance the trustworthiness and impact of dimensionality reduction-based analyses in a wide range of domains.
This summary was produced with help from an AI and may contain inaccuracies - check out the links to read the original source documents!
Related Papers
🤿
0
t-viSNE: Interactive Assessment and Interpretation of t-SNE Projections
Angelos Chatzimparmpas, Rafael M. Martins, Andreas Kerren
t-Distributed Stochastic Neighbor Embedding (t-SNE) for the visualization of multidimensional data has proven to be a popular approach, with successful applications in a wide range of domains. Despite their usefulness, t-SNE projections can be hard to interpret or even misleading, which hurts the trustworthiness of the results. Understanding the details of t-SNE itself and the reasons behind specific patterns in its output may be a daunting task, especially for non-experts in dimensionality reduction. In this work, we present t-viSNE, an interactive tool for the visual exploration of t-SNE projections that enables analysts to inspect different aspects of their accuracy and meaning, such as the effects of hyper-parameters, distance and neighborhood preservation, densities and costs of specific neighborhoods, and the correlations between dimensions and visual patterns. We propose a coherent, accessible, and well-integrated collection of different views for the visualization of t-SNE projections. The applicability and usability of t-viSNE are demonstrated through hypothetical usage scenarios with real data sets. Finally, we present the results of a user study where the tool's effectiveness was evaluated. By bringing to light information that would normally be lost after running t-SNE, we hope to support analysts in using t-SNE and making its results better understandable.
Read more4/19/2024
0
Exploring Layerwise Adversarial Robustness Through the Lens of t-SNE
In^es Valentim, Nuno Antunes, Nuno Lourenc{c}o
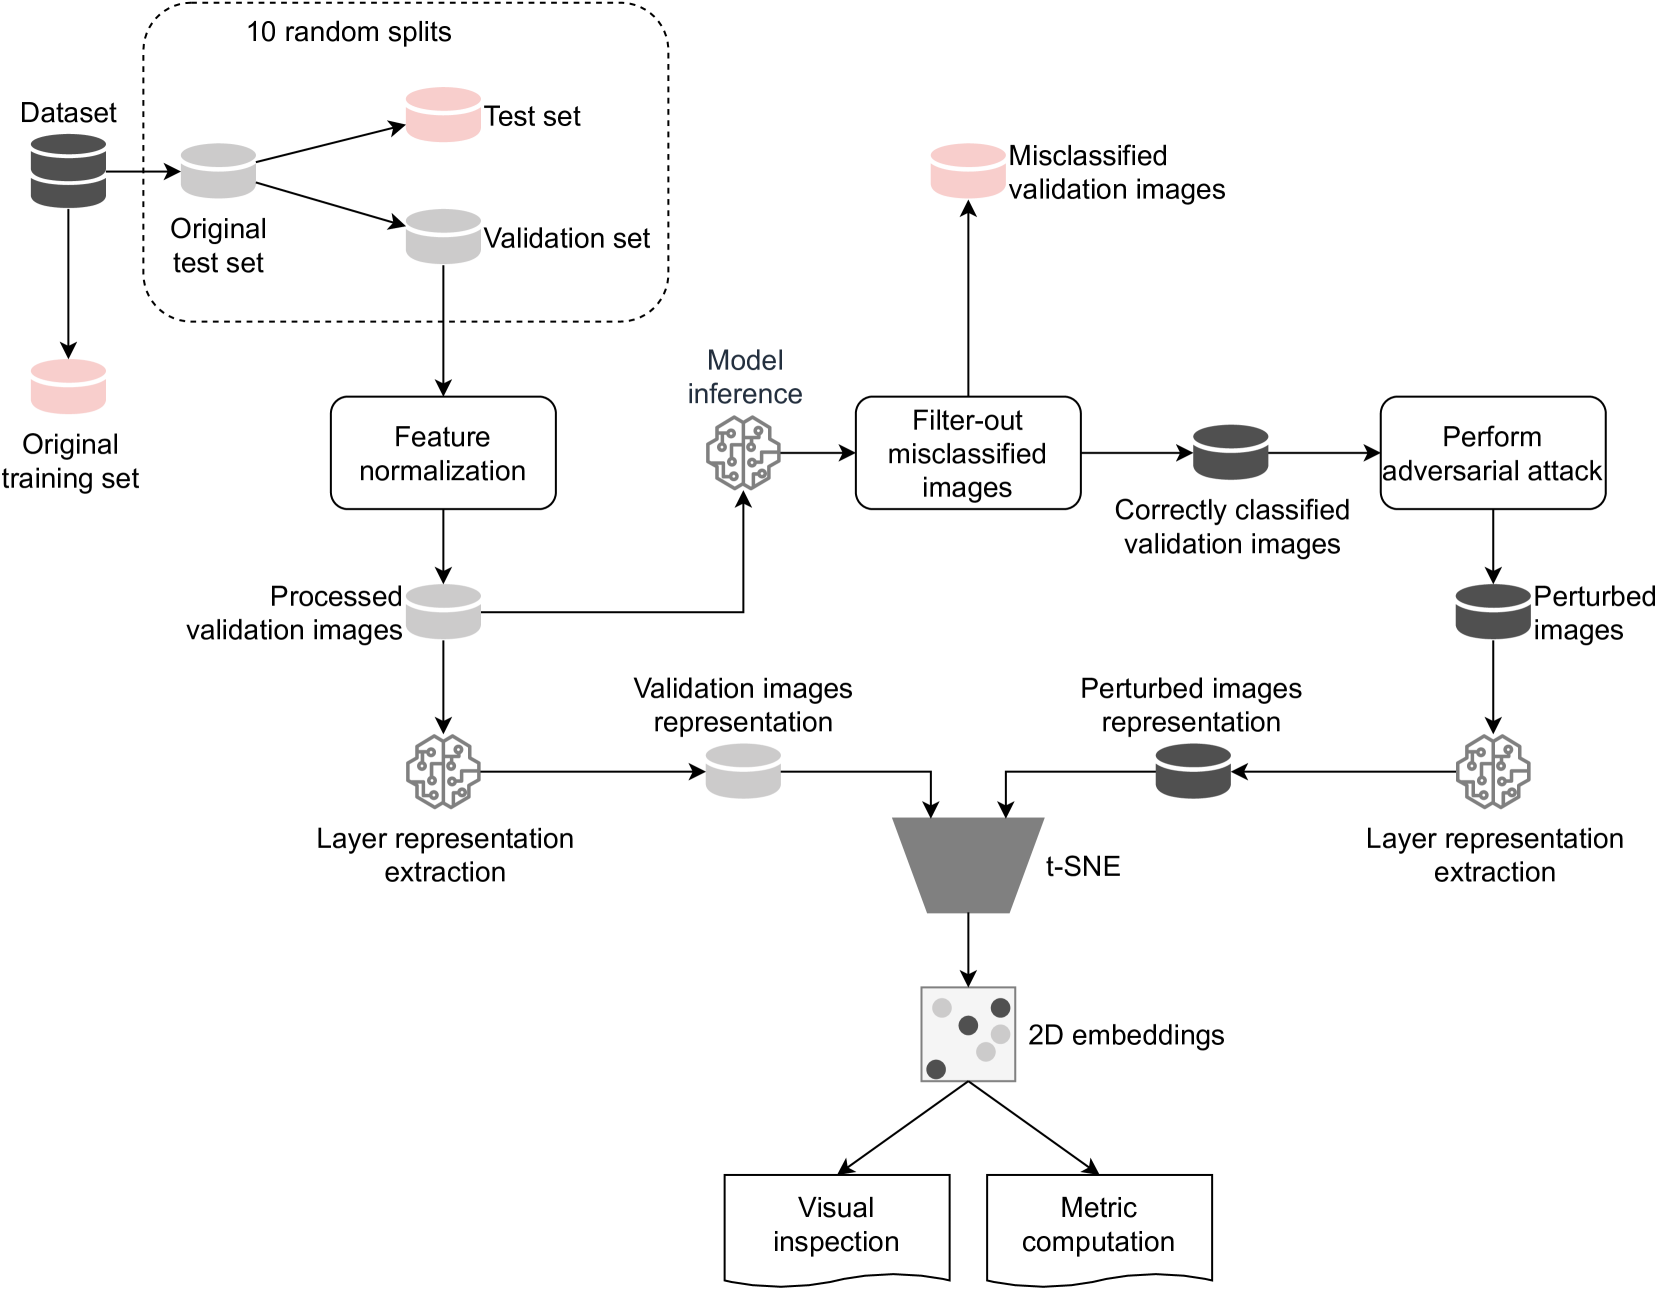
Adversarial examples, designed to trick Artificial Neural Networks (ANNs) into producing wrong outputs, highlight vulnerabilities in these models. Exploring these weaknesses is crucial for developing defenses, and so, we propose a method to assess the adversarial robustness of image-classifying ANNs. The t-distributed Stochastic Neighbor Embedding (t-SNE) technique is used for visual inspection, and a metric, which compares the clean and perturbed embeddings, helps pinpoint weak spots in the layers. Analyzing two ANNs on CIFAR-10, one designed by humans and another via NeuroEvolution, we found that differences between clean and perturbed representations emerge early on, in the feature extraction layers, affecting subsequent classification. The findings with our metric are supported by the visual analysis of the t-SNE maps.
Read more6/21/2024

0
New!Uncertainty-aware t-distributed Stochastic Neighbor Embedding for Single-cell RNA-seq Data
Hui Ma, Kai Chen
Nonlinear data visualization using t-distributed stochastic neighbor embedding (t-SNE) enables the representation of complex single-cell transcriptomic landscapes in two or three dimensions to depict biological populations accurately. However, t-SNE often fails to account for uncertainties in the original dataset, leading to misleading visualizations where cell subsets with noise appear indistinguishable. To address these challenges, we introduce uncertainty-aware t-SNE (Ut-SNE), a noise-defending visualization tool tailored for uncertain single-cell RNA-seq data. By creating a probabilistic representation for each sample, Our Ut-SNE accurately incorporates noise about transcriptomic variability into the visual interpretation of single-cell RNA sequencing data, revealing significant uncertainties in transcriptomic variability. Through various examples, we showcase the practical value of Ut-SNE and underscore the significance of incorporating uncertainty awareness into data visualization practices. This versatile uncertainty-aware visualization tool can be easily adapted to other scientific domains beyond single-cell RNA sequencing, making them valuable resources for high-dimensional data analysis.
Read more10/2/2024
0
Online t-SNE for single-cell RNA-seq
Hui Ma, Kai Chen
Due to the sequential sample arrival, changing experiment conditions, and evolution of knowledge, the demand to continually visualize evolving structures of sequential and diverse single-cell RNA-sequencing (scRNA-seq) data becomes indispensable. However, as one of the state-of-the-art visualization and analysis methods for scRNA-seq, t-distributed stochastic neighbor embedding (t-SNE) merely visualizes static scRNA-seq data offline and fails to meet the demand well. To address these challenges, we introduce online t-SNE to seamlessly integrate sequential scRNA-seq data. Online t-SNE achieves this by leveraging the embedding space of old samples, exploring the embedding space of new samples, and aligning the two embedding spaces on the fly. Consequently, online t-SNE dramatically enables the continual discovery of new structures and high-quality visualization of new scRNA-seq data without retraining from scratch. We showcase the formidable visualization capabilities of online t-SNE across diverse sequential scRNA-seq datasets.
Read more6/24/2024