VisLTR: Visualization-in-the-Loop Table Reasoning

0
Sign in to get full access
Overview
• This paper introduces VisLTR, a novel approach that integrates visualization into the table reasoning process to enhance the capabilities of large language models (LLMs) in understanding and analyzing tabular data.
• VisLTR combines the strengths of computer vision and natural language processing to enable LLMs to reason about tables more effectively, leading to improved performance on table-related tasks.
Plain English Explanation
• VisLTR is a new system that helps AI models, like GPT, better understand and work with data in tables.
• Tables can be tricky for AI to deal with, as they have a different structure than normal text. VisLTR bridges this gap by using visual information along with the text in the tables.
• By combining the power of computer vision (to understand the visual layout of tables) and natural language processing (to interpret the textual content), VisLTR enables AI models to reason about tables more effectively.
• This leads to better performance on tasks that involve working with tabular data, such as answering questions, making inferences, or extracting insights from tables.
Technical Explanation
• VisLTR extends the capabilities of LLMs by incorporating visual information about table structure, in addition to the textual content.
• The system first encodes the visual layout of a table using a computer vision model, capturing details like row and column structure, cell borders, and other visual cues.
• This visual encoding is then combined with the textual encoding of the table content, produced by an LLM like GPT.
• The combined representation is then used for various table-related tasks, such as answering questions about the table or generating relevant visualizations.
• VisLTR is evaluated on a range of benchmarks, demonstrating significant improvements over LLM-only baselines on tasks like table question answering and table-to-text generation.
Critical Analysis
• The paper acknowledges that VisLTR's performance is still limited by the capabilities of the underlying LLM, and further advancements in language modeling may be needed to fully unlock the potential of table reasoning.
• Additionally, the authors note that VisLTR's reliance on computer vision models may make it less applicable to tables with more complex visual structures or non-standard layouts, which could limit its generalization.
• [Incorporating more advanced reasoning capabilities, such as graphical reasoning or highlighted evidence augmentation, could further enhance VisLTR's table understanding abilities.
Conclusion
• VisLTR represents a promising step towards bridging the gap between LLMs and tabular data understanding, by leveraging both textual and visual information.
• By integrating visualization into the table reasoning process, VisLTR demonstrates improved performance on a range of table-related tasks, with potential applications in data analysis, question answering, and report generation.
• As language models and computer vision techniques continue to advance, further research in this direction could lead to even more powerful systems for working with and extracting insights from tabular data.
This summary was produced with help from an AI and may contain inaccuracies - check out the links to read the original source documents!
Related Papers
0
VisLTR: Visualization-in-the-Loop Table Reasoning
Jianing Hao, Zhuowen Liang, Chunting Li, Yuyu Luo, Wei Zeng
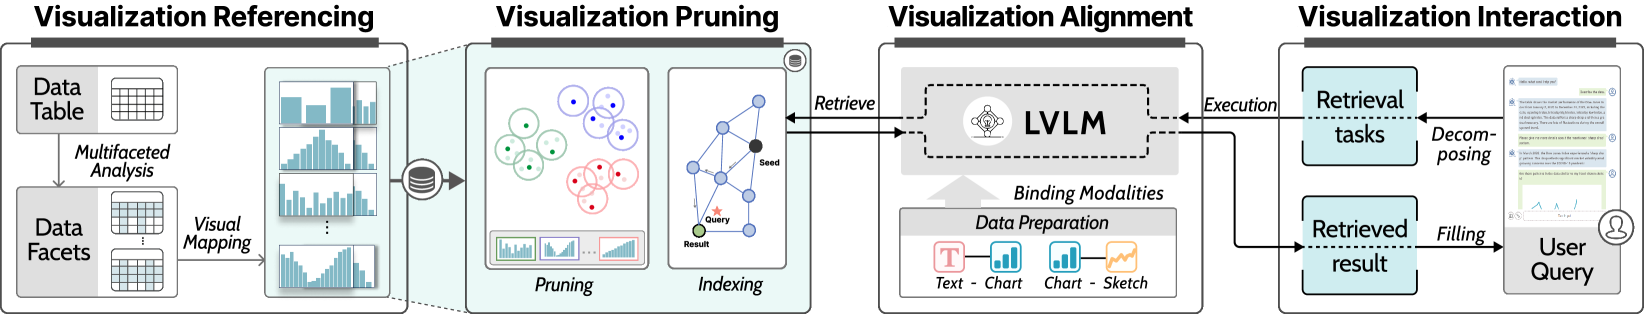
Table reasoning transforms user requirements into corresponding answers according to the provided table, which is often integrated with natural language interfaces for lay users to explore tabular data effortlessly. Recent research exploits large language models to facilitate table reasoning, by transforming vague user requirements into structured query languages (SQLs). However, these SQL-based approaches often overlook changes in data patterns, suffer from LLM drift, and limit exploration to only text queries. To this end, VisLTR is designed as a visualization-in-the-loop table reasoning framework that leverages visualizations as a proxy to provide concise data representations, capture interesting data patterns, and support cross-modal analysis. We describe VisLTR as a process consisting of four major modules: 1) visualization alignment that utilizes large vision-language models to align visualizations across various modalities, including chart, text, and sketch; 2) visualization referencing that decomposes a table into multifaceted visualization references that comprehensively represent the table; 3) visualization pruning that incorporates data and retrieval pruning to excise visualization references with poor information and enhance retrieval efficiency; and 4) visualization interaction that offers an interactive visual interface with multi-modal interactions for user-friendly table reasoning. Quantitative evaluation demonstrates the effectiveness of the alignment model in cross-modal visualization pairings. We further demonstrate applications of the framework on various table reasoning tasks such as table summarization and pattern detection.
Read more6/7/2024
0
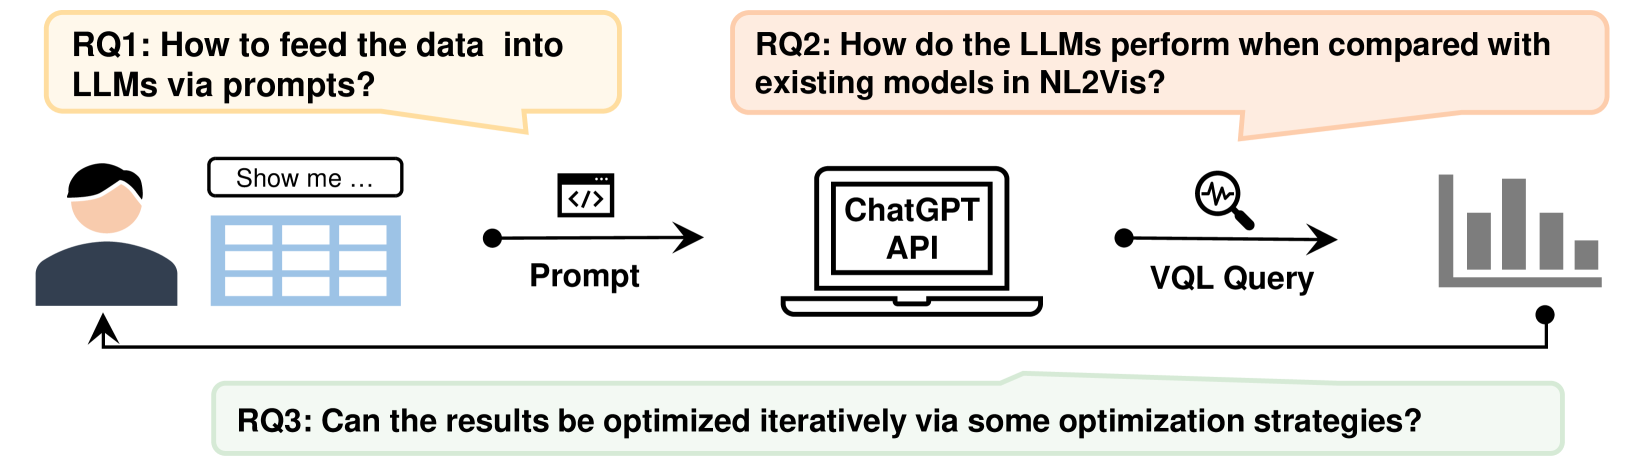
Automated Data Visualization from Natural Language via Large Language Models: An Exploratory Study
Yang Wu, Yao Wan, Hongyu Zhang, Yulei Sui, Wucai Wei, Wei Zhao, Guandong Xu, Hai Jin
The Natural Language to Visualization (NL2Vis) task aims to transform natural-language descriptions into visual representations for a grounded table, enabling users to gain insights from vast amounts of data. Recently, many deep learning-based approaches have been developed for NL2Vis. Despite the considerable efforts made by these approaches, challenges persist in visualizing data sourced from unseen databases or spanning multiple tables. Taking inspiration from the remarkable generation capabilities of Large Language Models (LLMs), this paper conducts an empirical study to evaluate their potential in generating visualizations, and explore the effectiveness of in-context learning prompts for enhancing this task. In particular, we first explore the ways of transforming structured tabular data into sequential text prompts, as to feed them into LLMs and analyze which table content contributes most to the NL2Vis. Our findings suggest that transforming structured tabular data into programs is effective, and it is essential to consider the table schema when formulating prompts. Furthermore, we evaluate two types of LLMs: finetuned models (e.g., T5-Small) and inference-only models (e.g., GPT-3.5), against state-of-the-art methods, using the NL2Vis benchmarks (i.e., nvBench). The experimental results reveal that LLMs outperform baselines, with inference-only models consistently exhibiting performance improvements, at times even surpassing fine-tuned models when provided with certain few-shot demonstrations through in-context learning. Finally, we analyze when the LLMs fail in NL2Vis, and propose to iteratively update the results using strategies such as chain-of-thought, role-playing, and code-interpreter. The experimental results confirm the efficacy of iterative updates and hold great potential for future study.
Read more4/29/2024
0
Beyond Embeddings: The Promise of Visual Table in Visual Reasoning
Yiwu Zhong, Zi-Yuan Hu, Michael R. Lyu, Liwei Wang
Visual representation learning has been a cornerstone in computer vision, involving typical forms such as visual embeddings, structural symbols, and text-based representations. Despite the success of CLIP-type visual embeddings, they often lack access to world knowledge critical for visual reasoning. In this work, we propose Visual Table, a novel form of visual representation tailored for visual reasoning. Visual tables are constructed as hierarchical descriptions of visual scenes, featuring a scene description and multiple object-centric descriptions covering categories, attributes, and knowledge. Thanks to the structural and textual formats, visual tables offer unique advantages over mere visual embeddings, such as interpretability and controllable editing. Furthermore, they deliver instance-level world knowledge and detailed attributes that are essential for visual reasoning. To create visual tables, we develop a generator trained on the dataset with collected, small-scale annotations. Extensive results on 11 visual reasoning benchmarks demonstrate that the generated visual tables significantly outperform previous structural and text-based representations. Moreover, they consistently enhance state-of-the-art multimodal large language models across diverse benchmarks, showcasing their potential for advancing visual reasoning tasks. Our code is available at https://github.com/LaVi-Lab/Visual-Table.
Read more6/18/2024

0
Tables as Texts or Images: Evaluating the Table Reasoning Ability of LLMs and MLLMs
Naihao Deng, Zhenjie Sun, Ruiqi He, Aman Sikka, Yulong Chen, Lin Ma, Yue Zhang, Rada Mihalcea
In this paper, we investigate the effectiveness of various LLMs in interpreting tabular data through different prompting strategies and data formats. Our analyses extend across six benchmarks for table-related tasks such as question-answering and fact-checking. We introduce for the first time the assessment of LLMs' performance on image-based table representations. Specifically, we compare five text-based and three image-based table representations, demonstrating the role of representation and prompting on LLM performance. Our study provides insights into the effective use of LLMs on table-related tasks.
Read more6/7/2024